Neo4j
After winning the Neo4j pitch, we were commissioned to create a series of 15 video explainers covering different technologies, tools, and industry use cases, all brought to life through a consistent visual language based on their new brand guidelines.
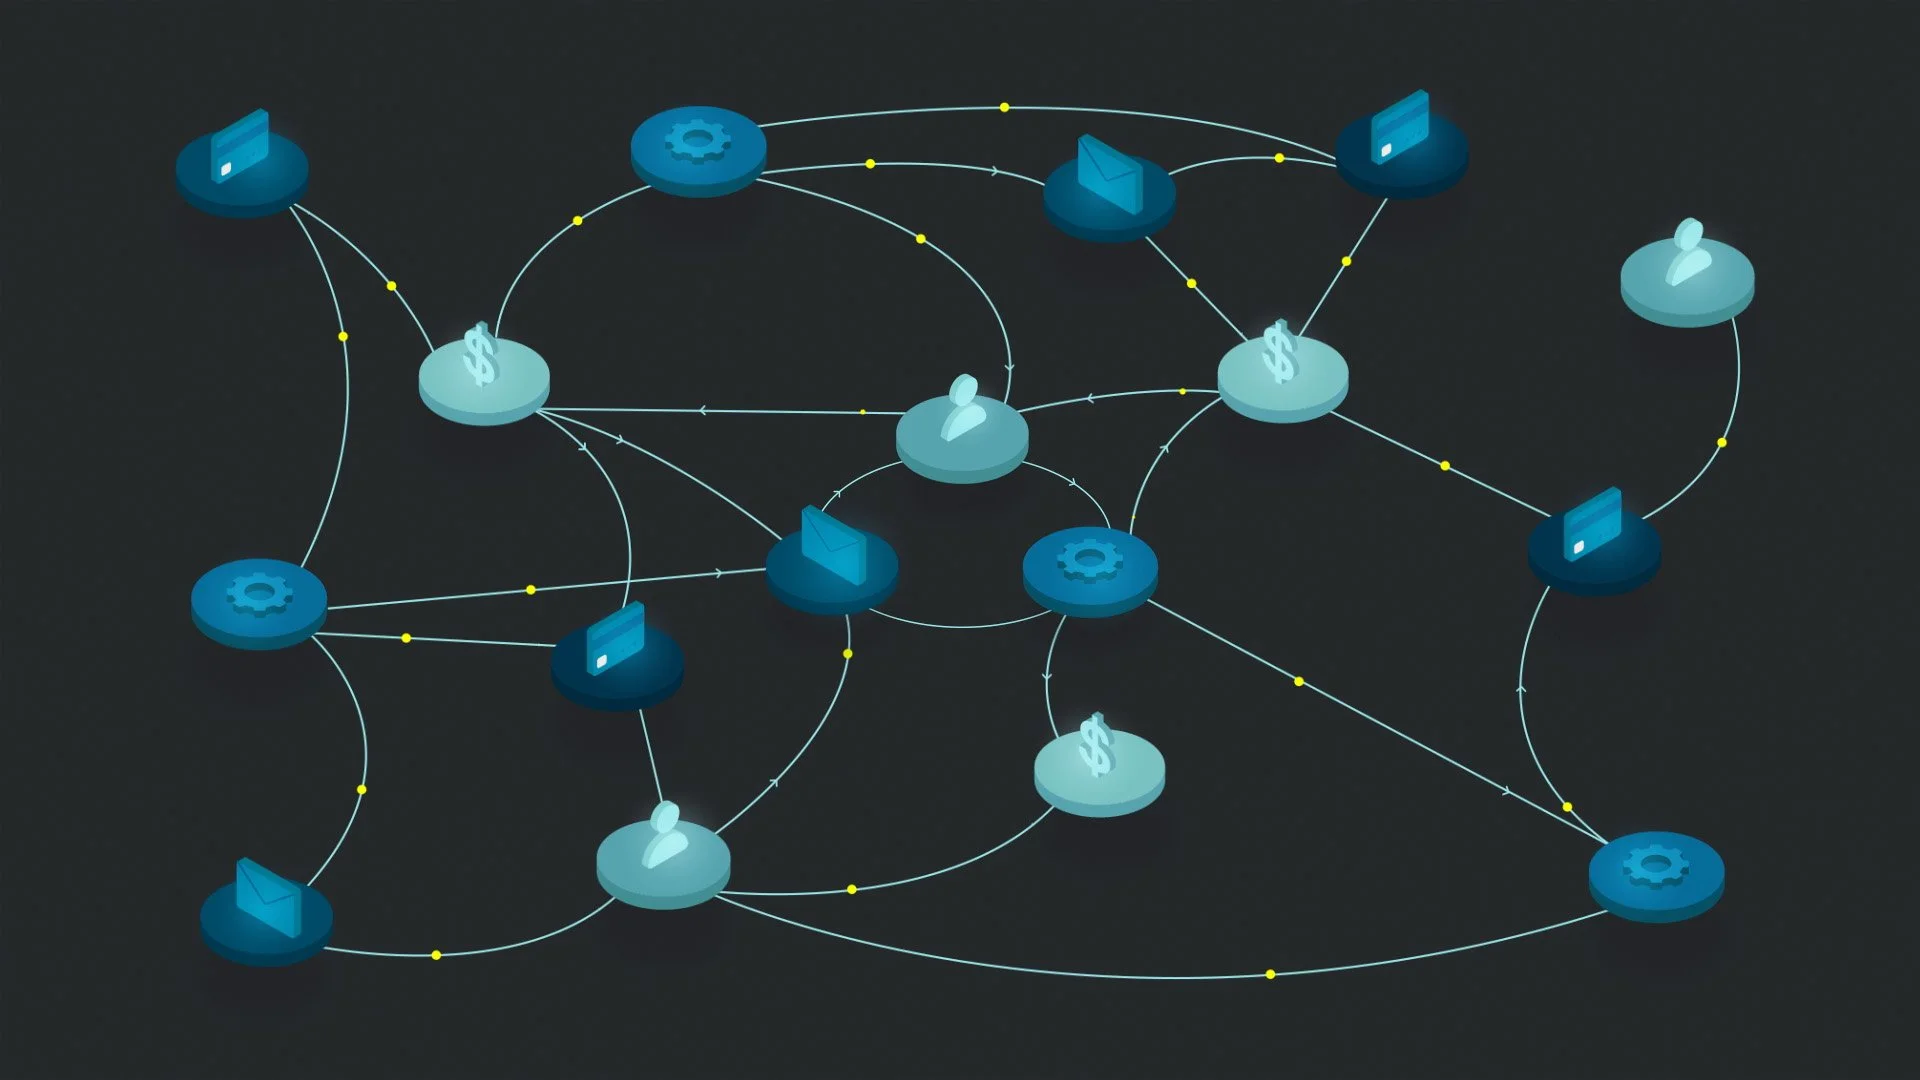
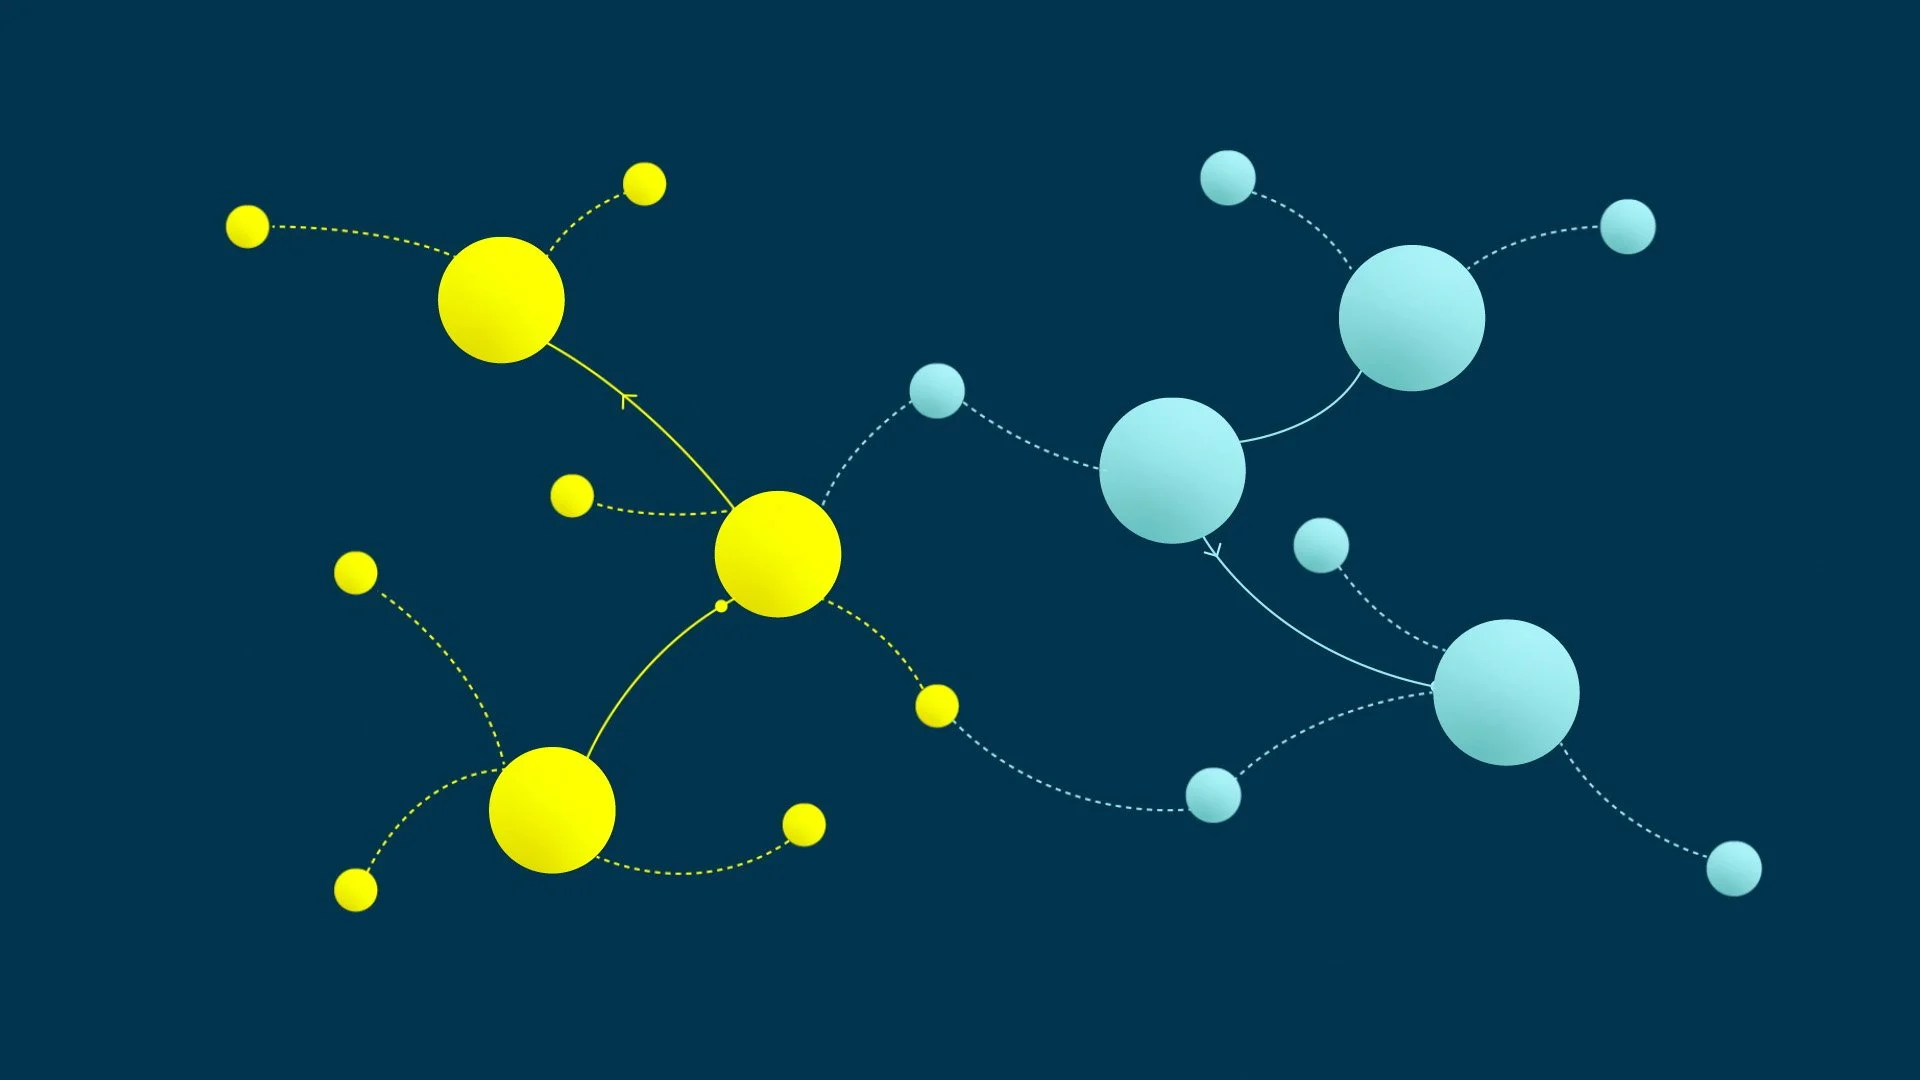
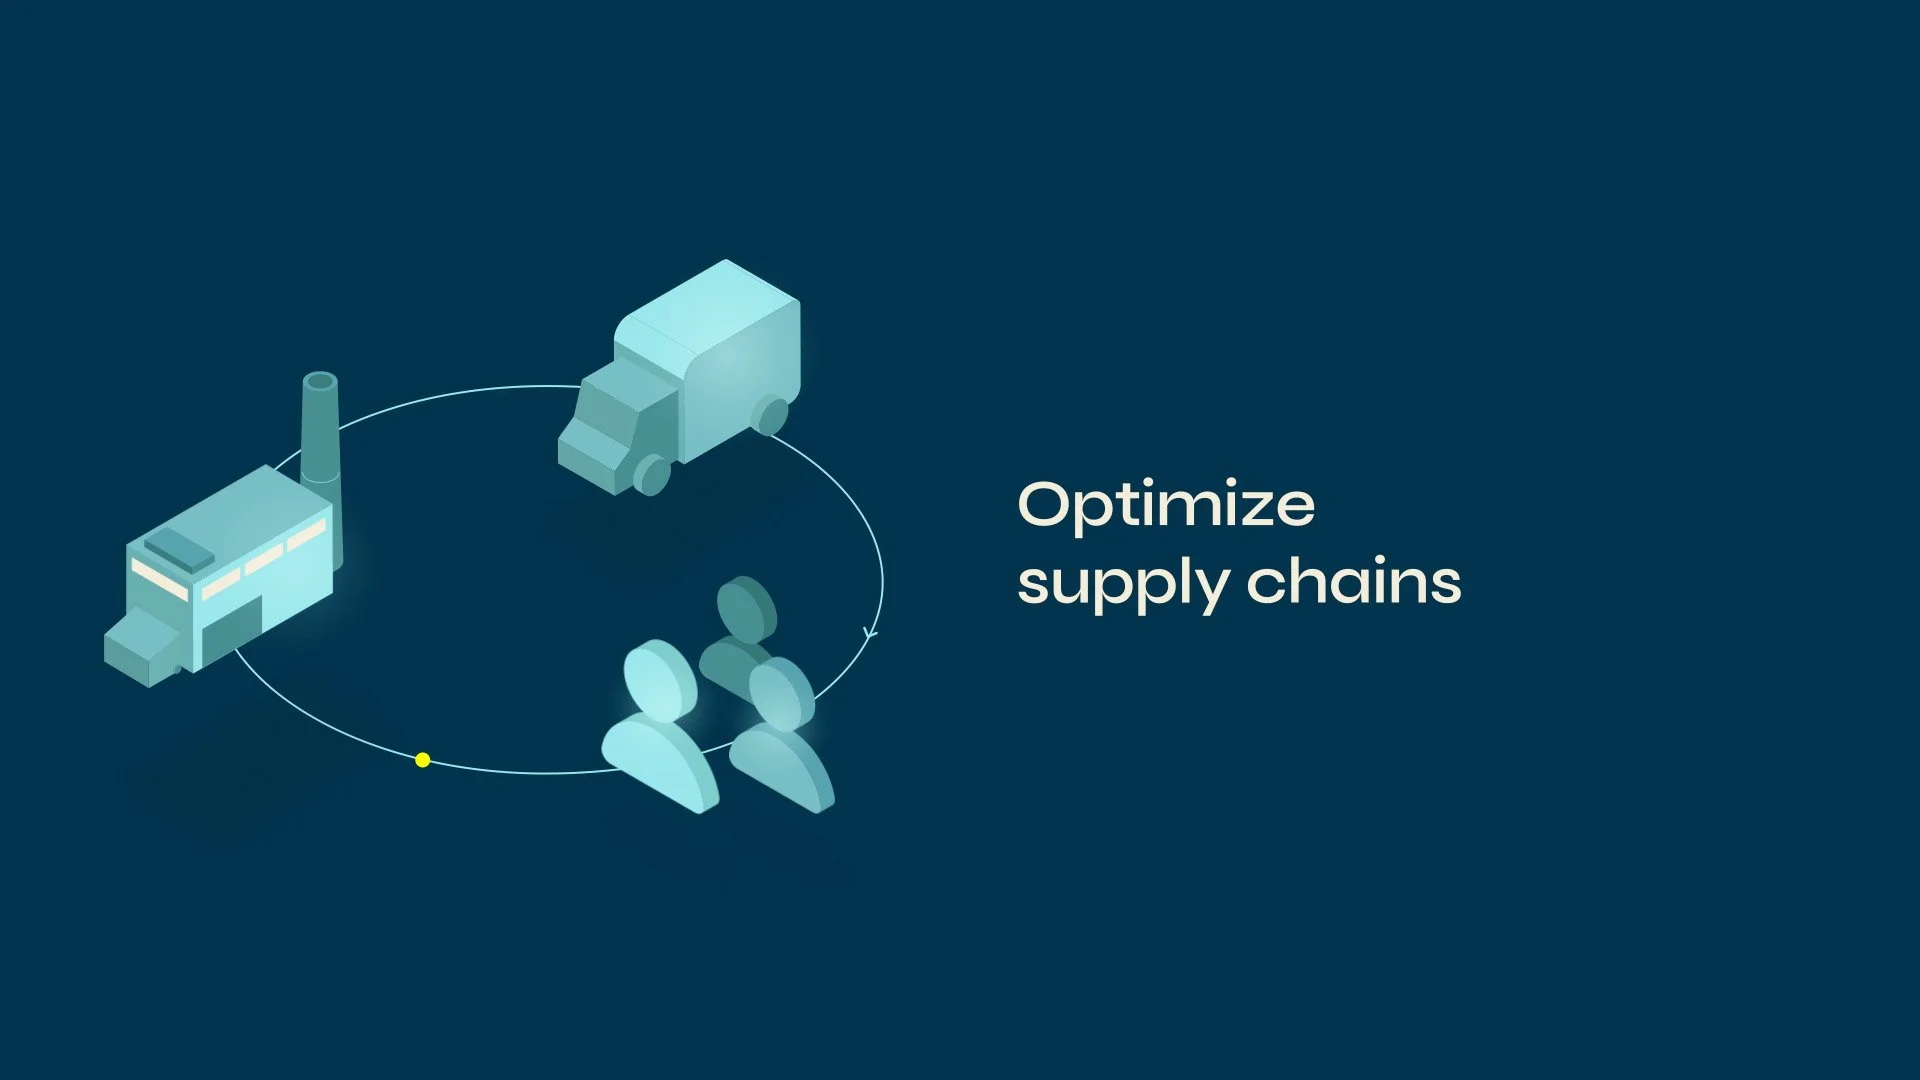
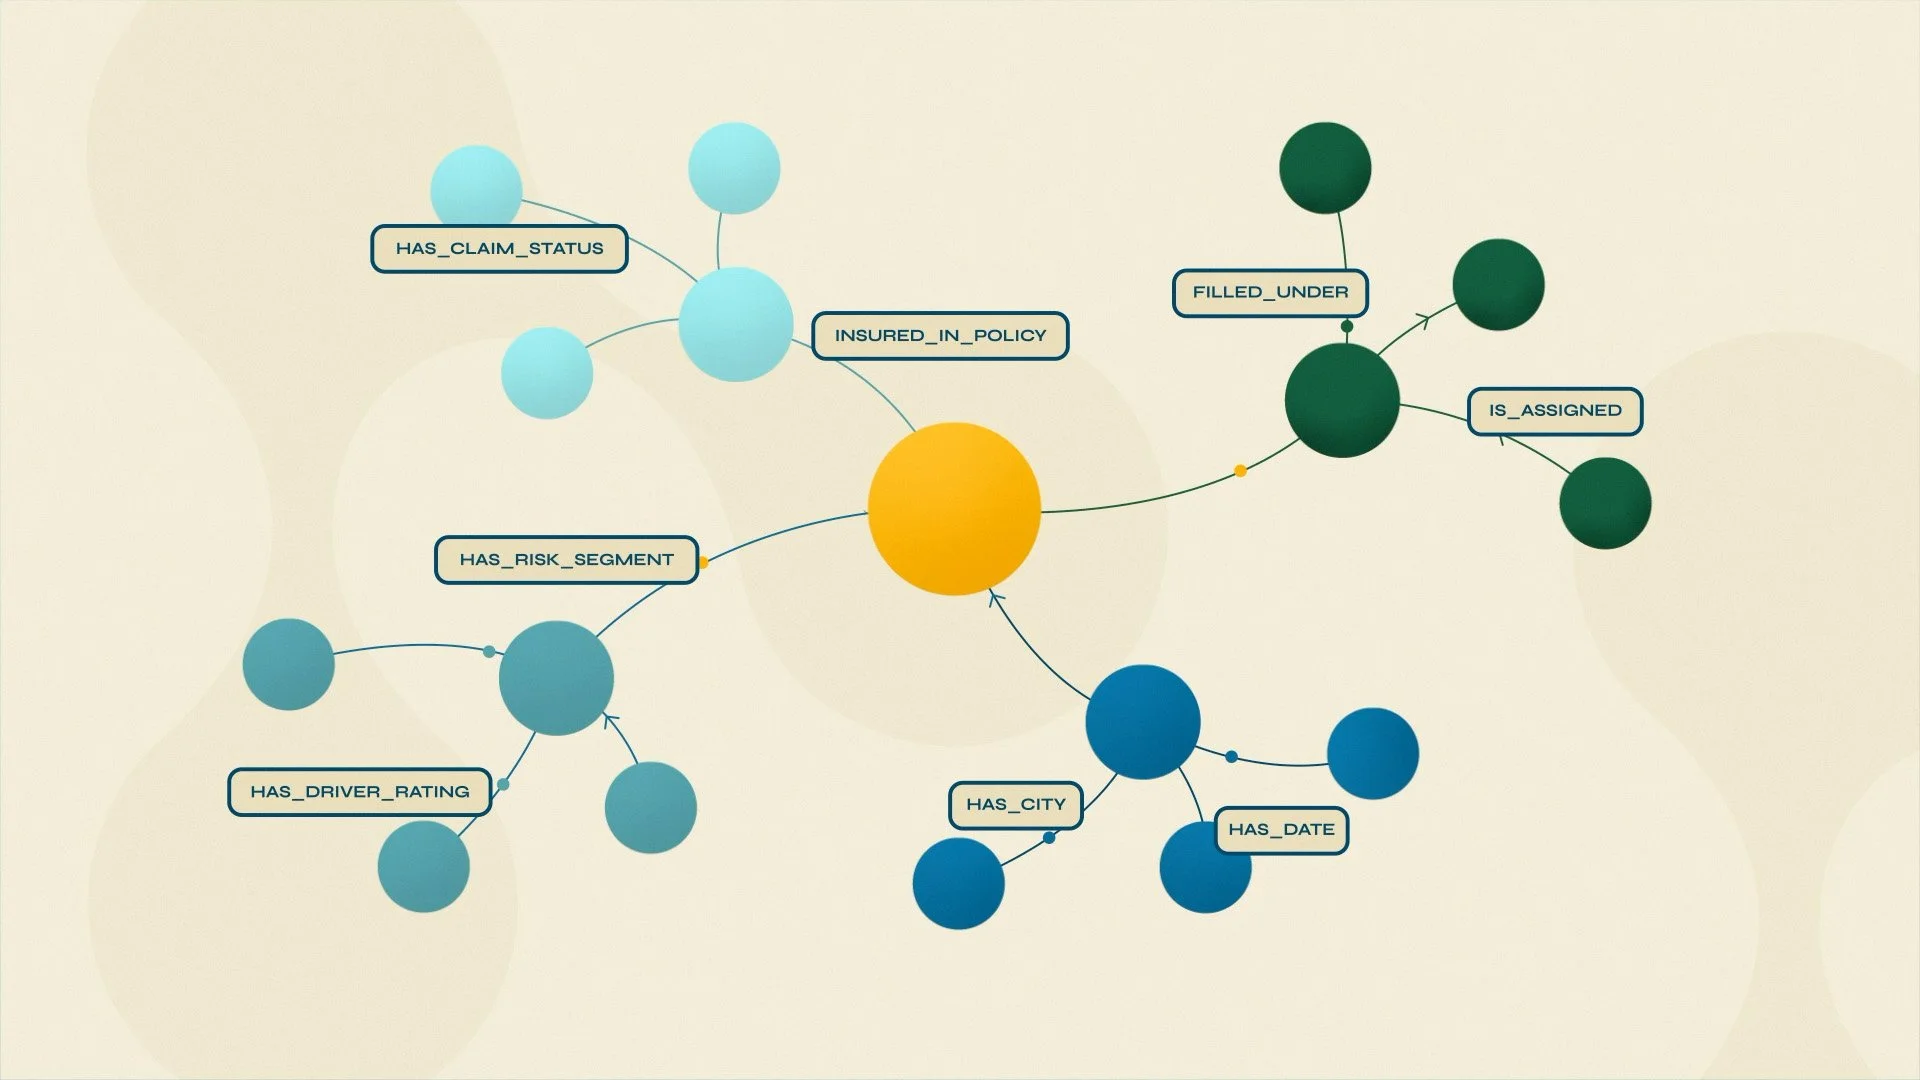
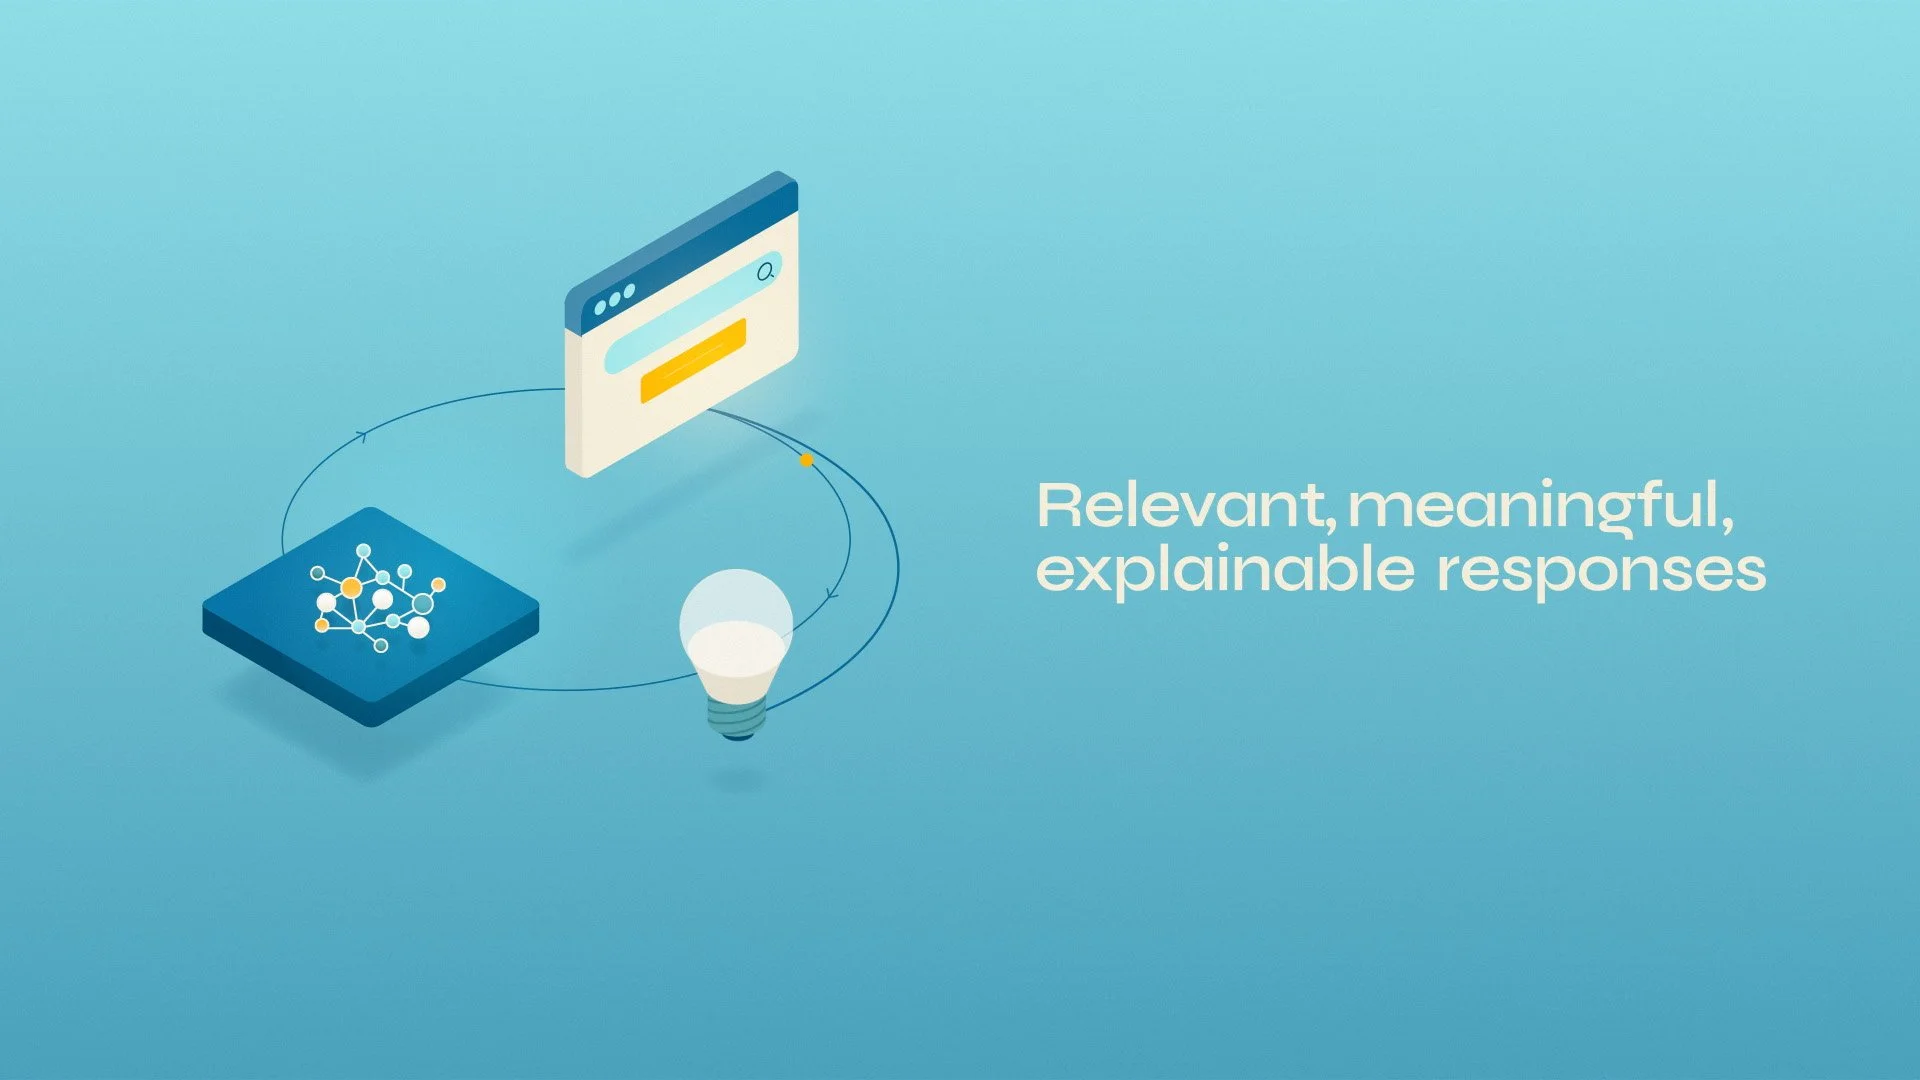
We developed an isometric illustration system specifically designed to simplify the technical understanding of what Neo4j does, translating complex concepts, data relationships, and processes into visuals that feel clear, attractive, and easy to follow.
The goal throughout the series was to give audiences a clear visuals of how Neo4j’s Graph Database and Analytics technology works, its real-world applications, and the value behind its solutions.
Seven Graphs - Explainer Video Pack
Client | Neo4j
Agency | Demo Duck

Neo4j | Seven Graphs

The other spots
Neo4j | Aura DB
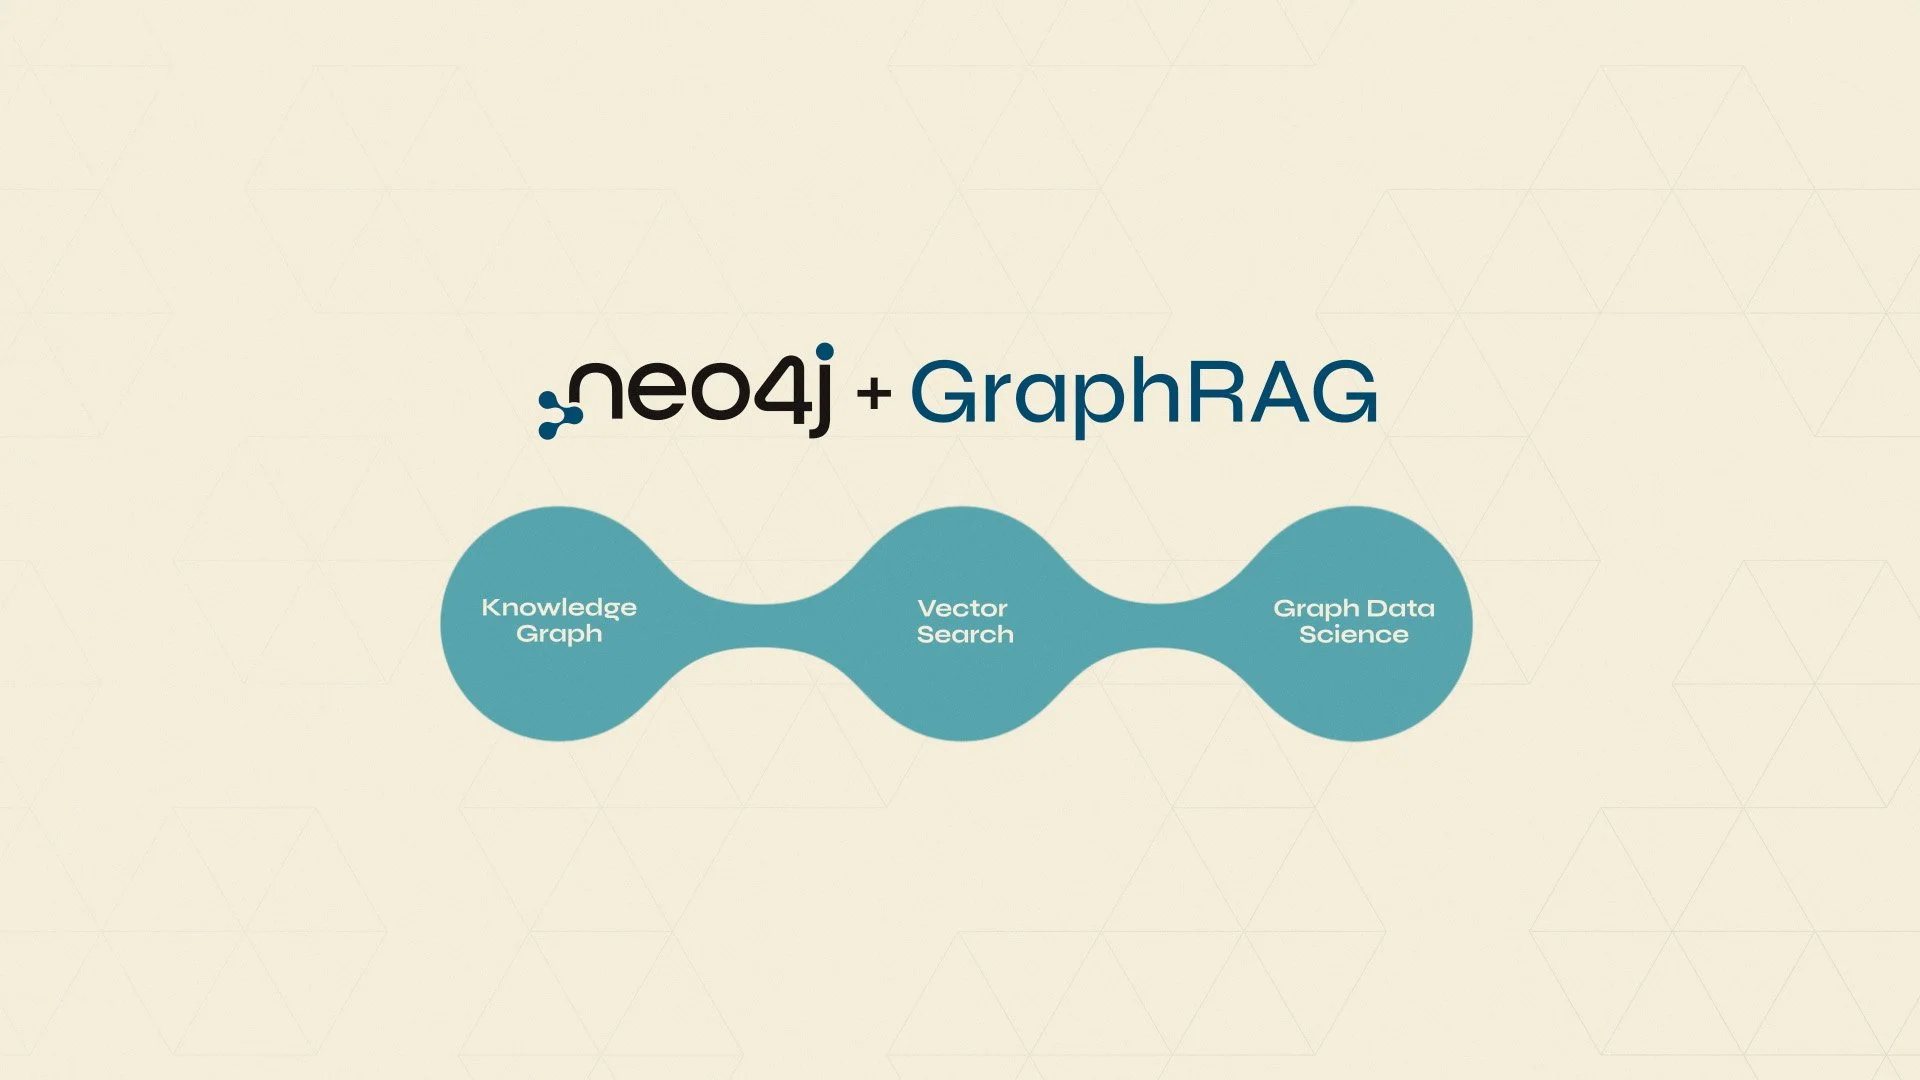
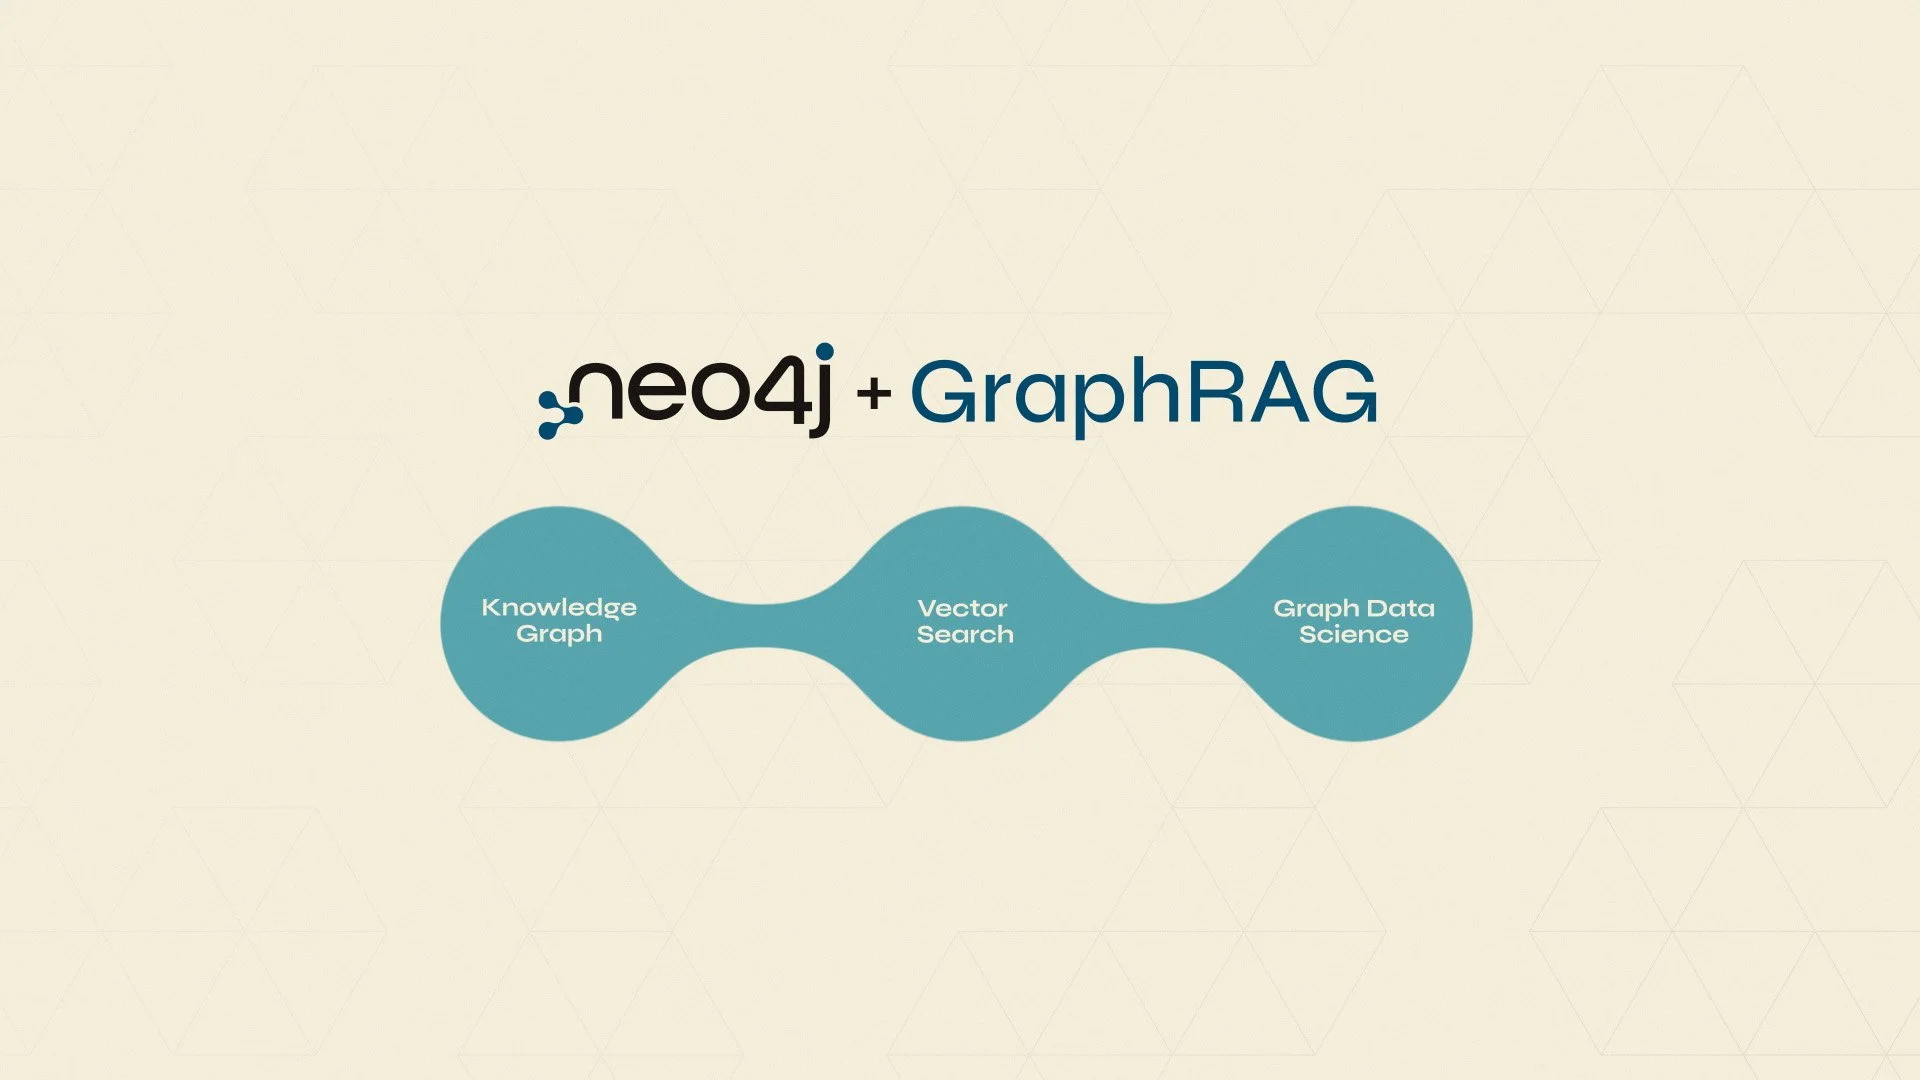
Neo4j | Graph RAG

Neo4j | Knowledge
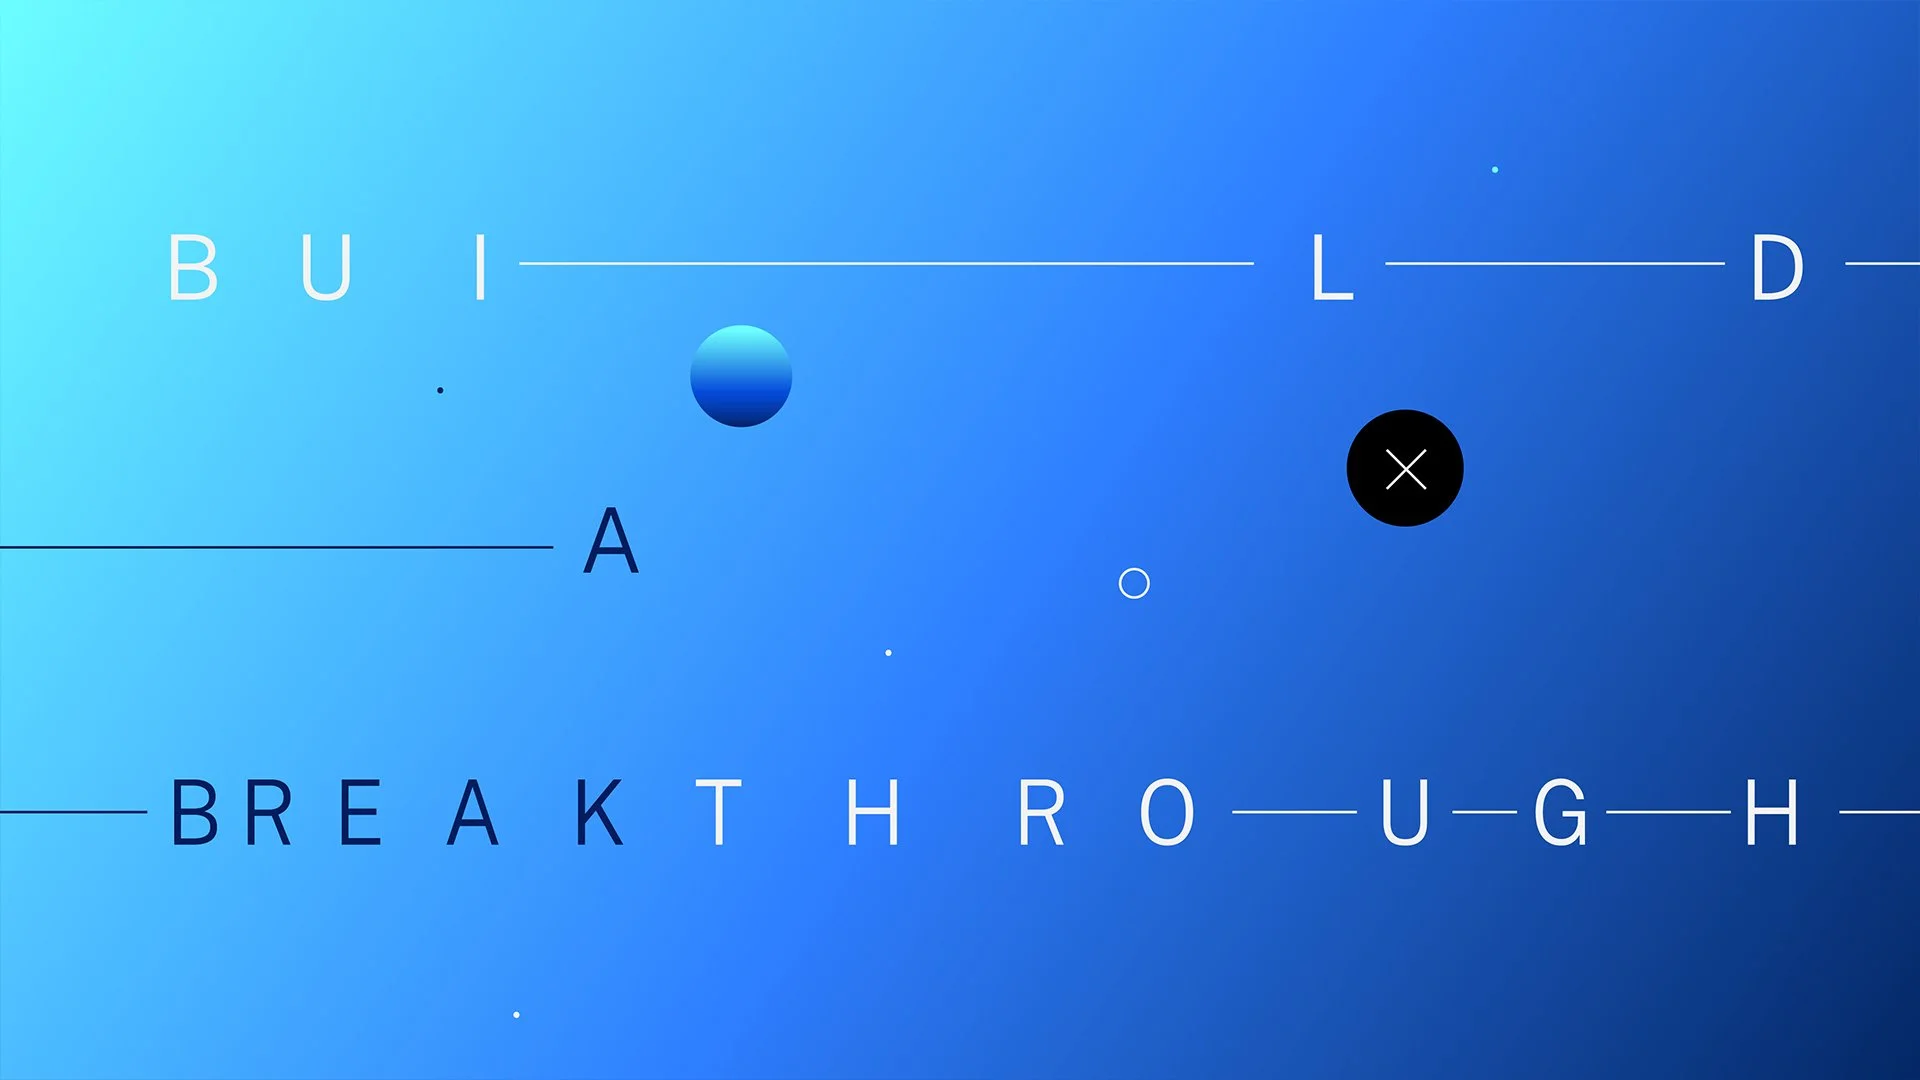
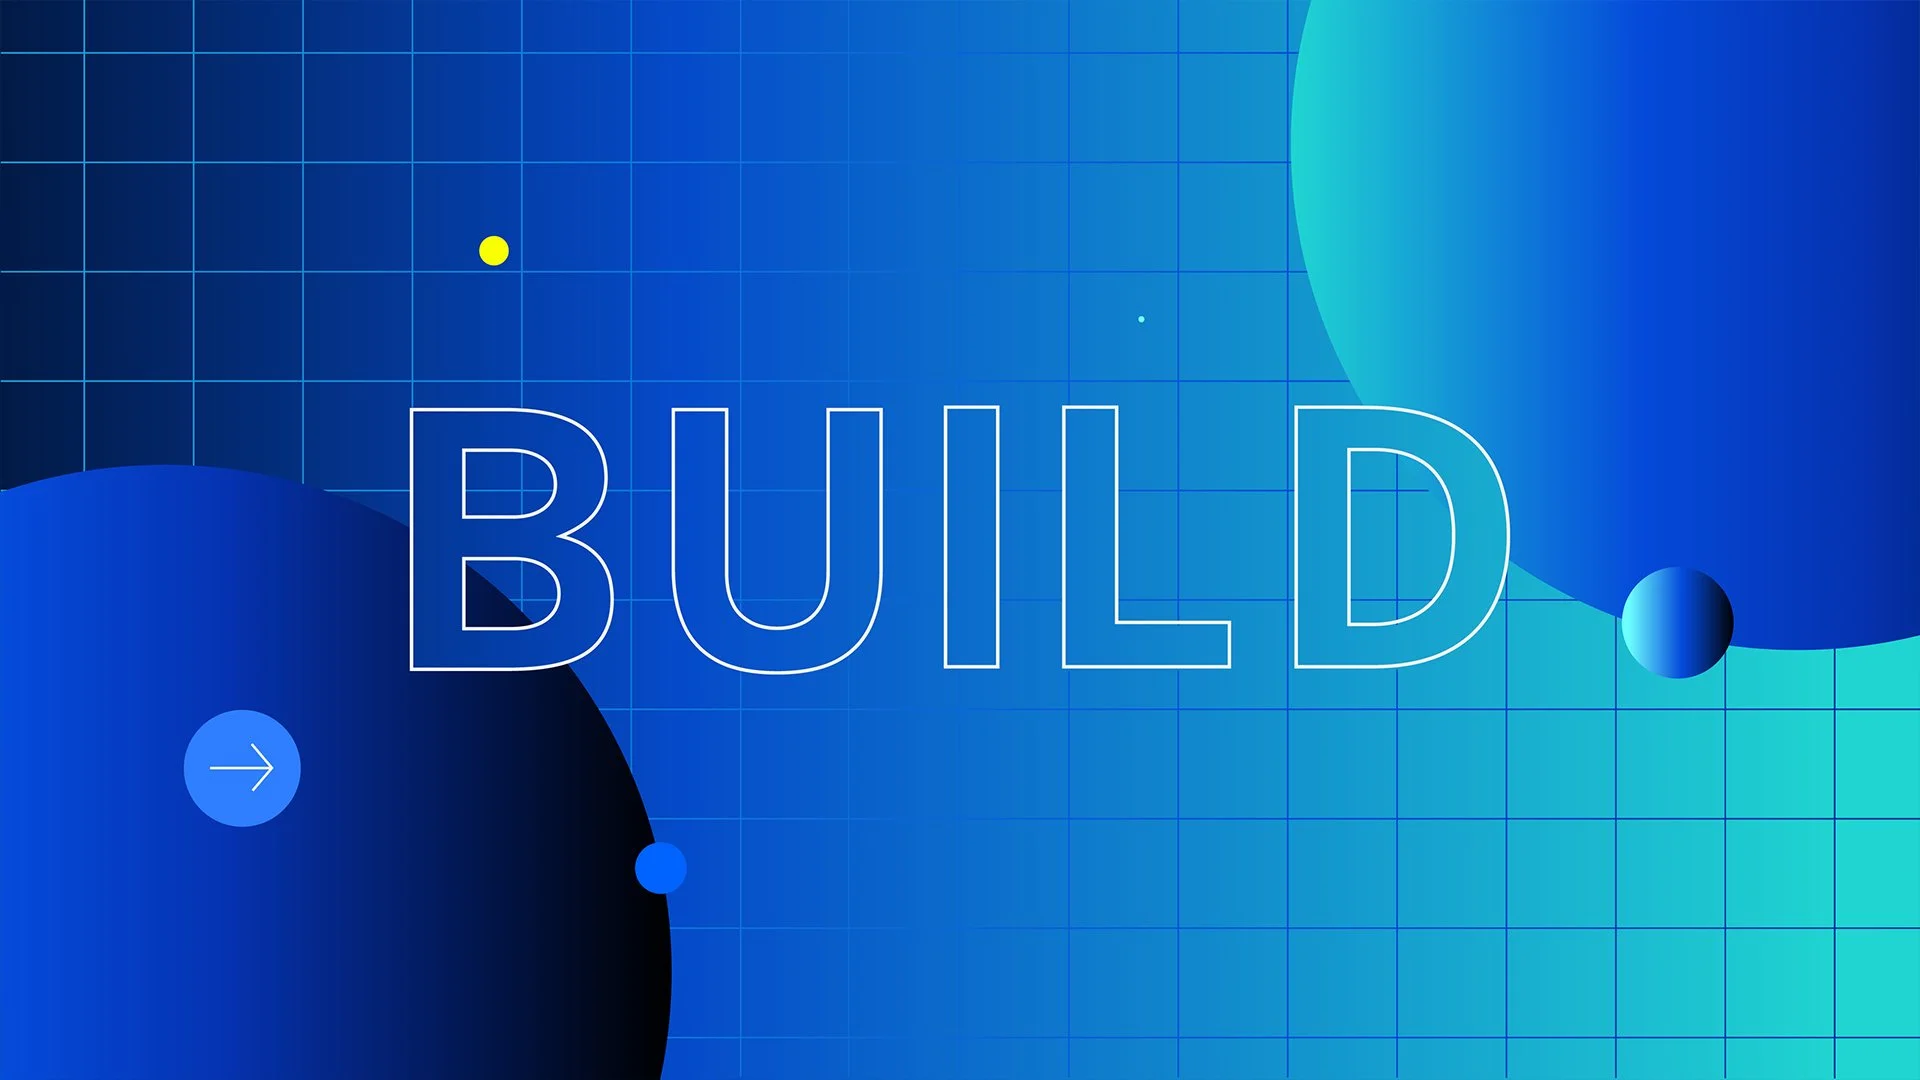
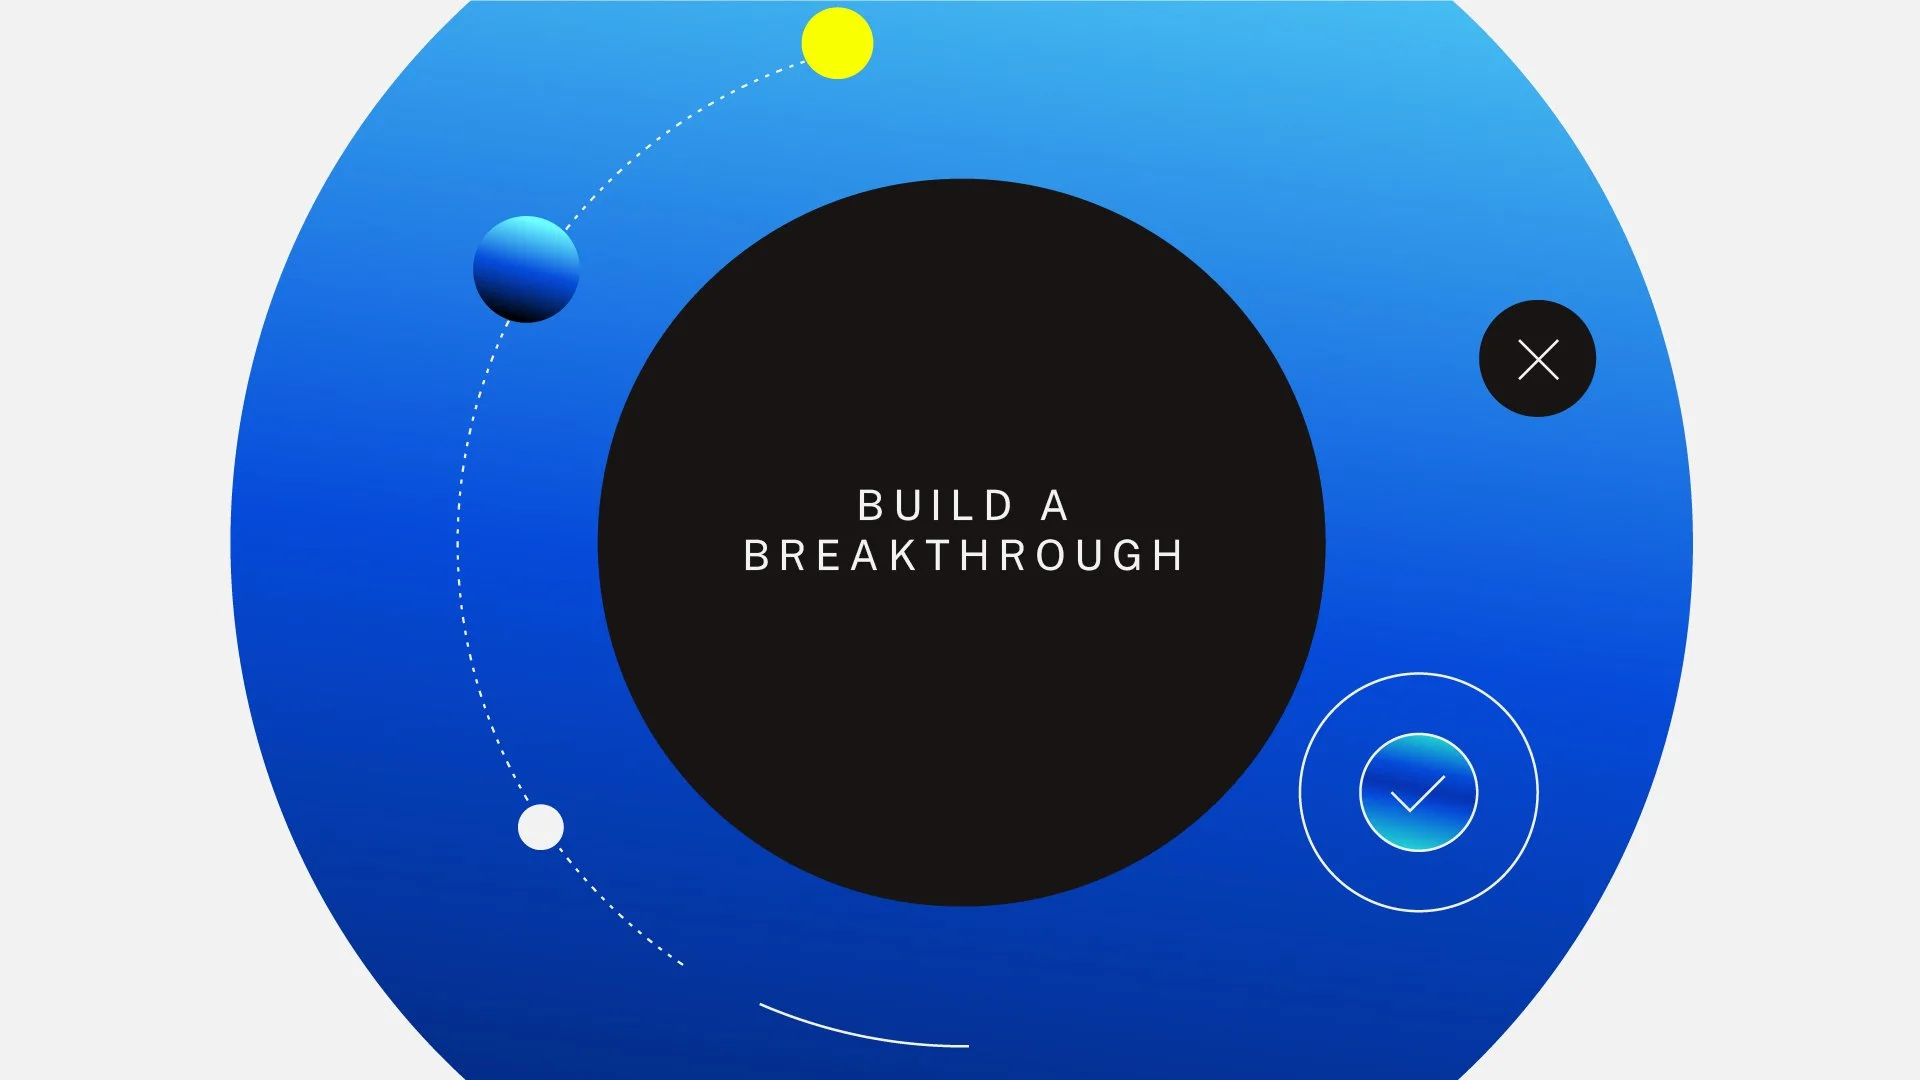
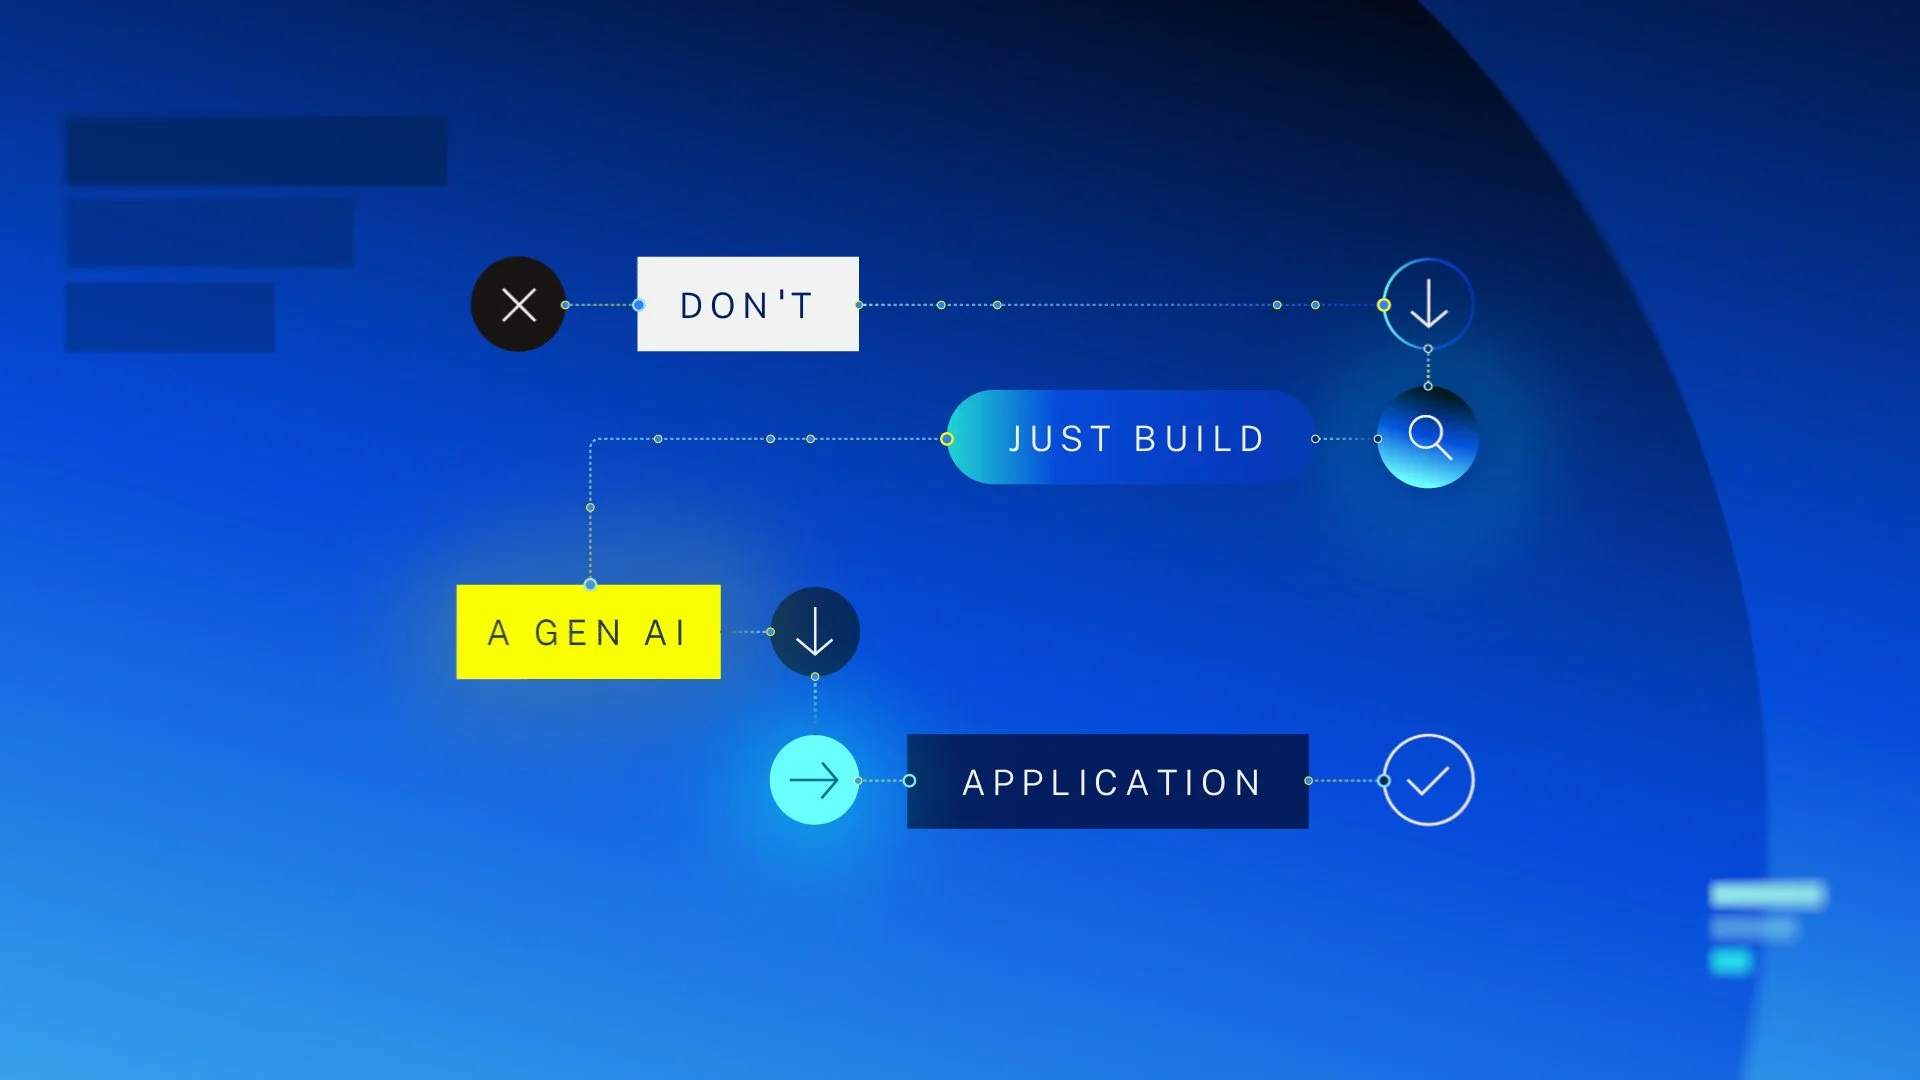
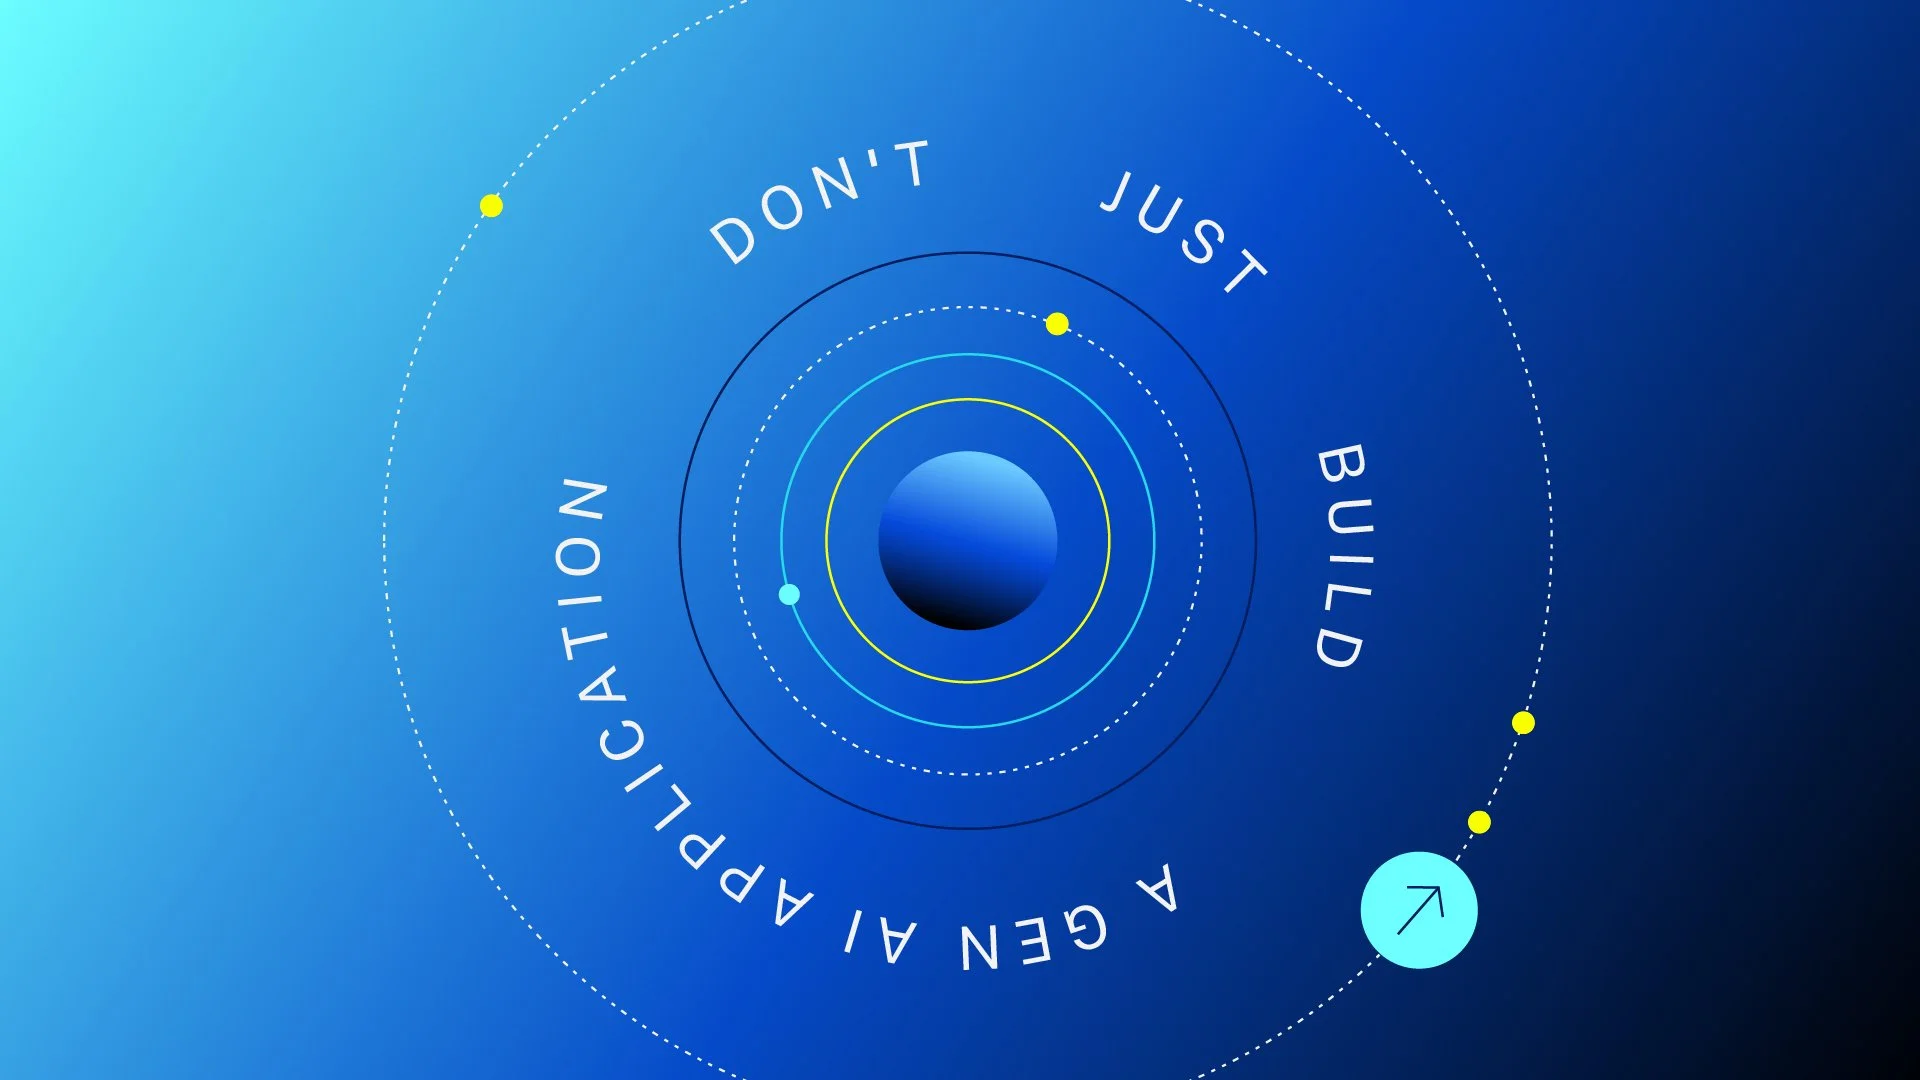
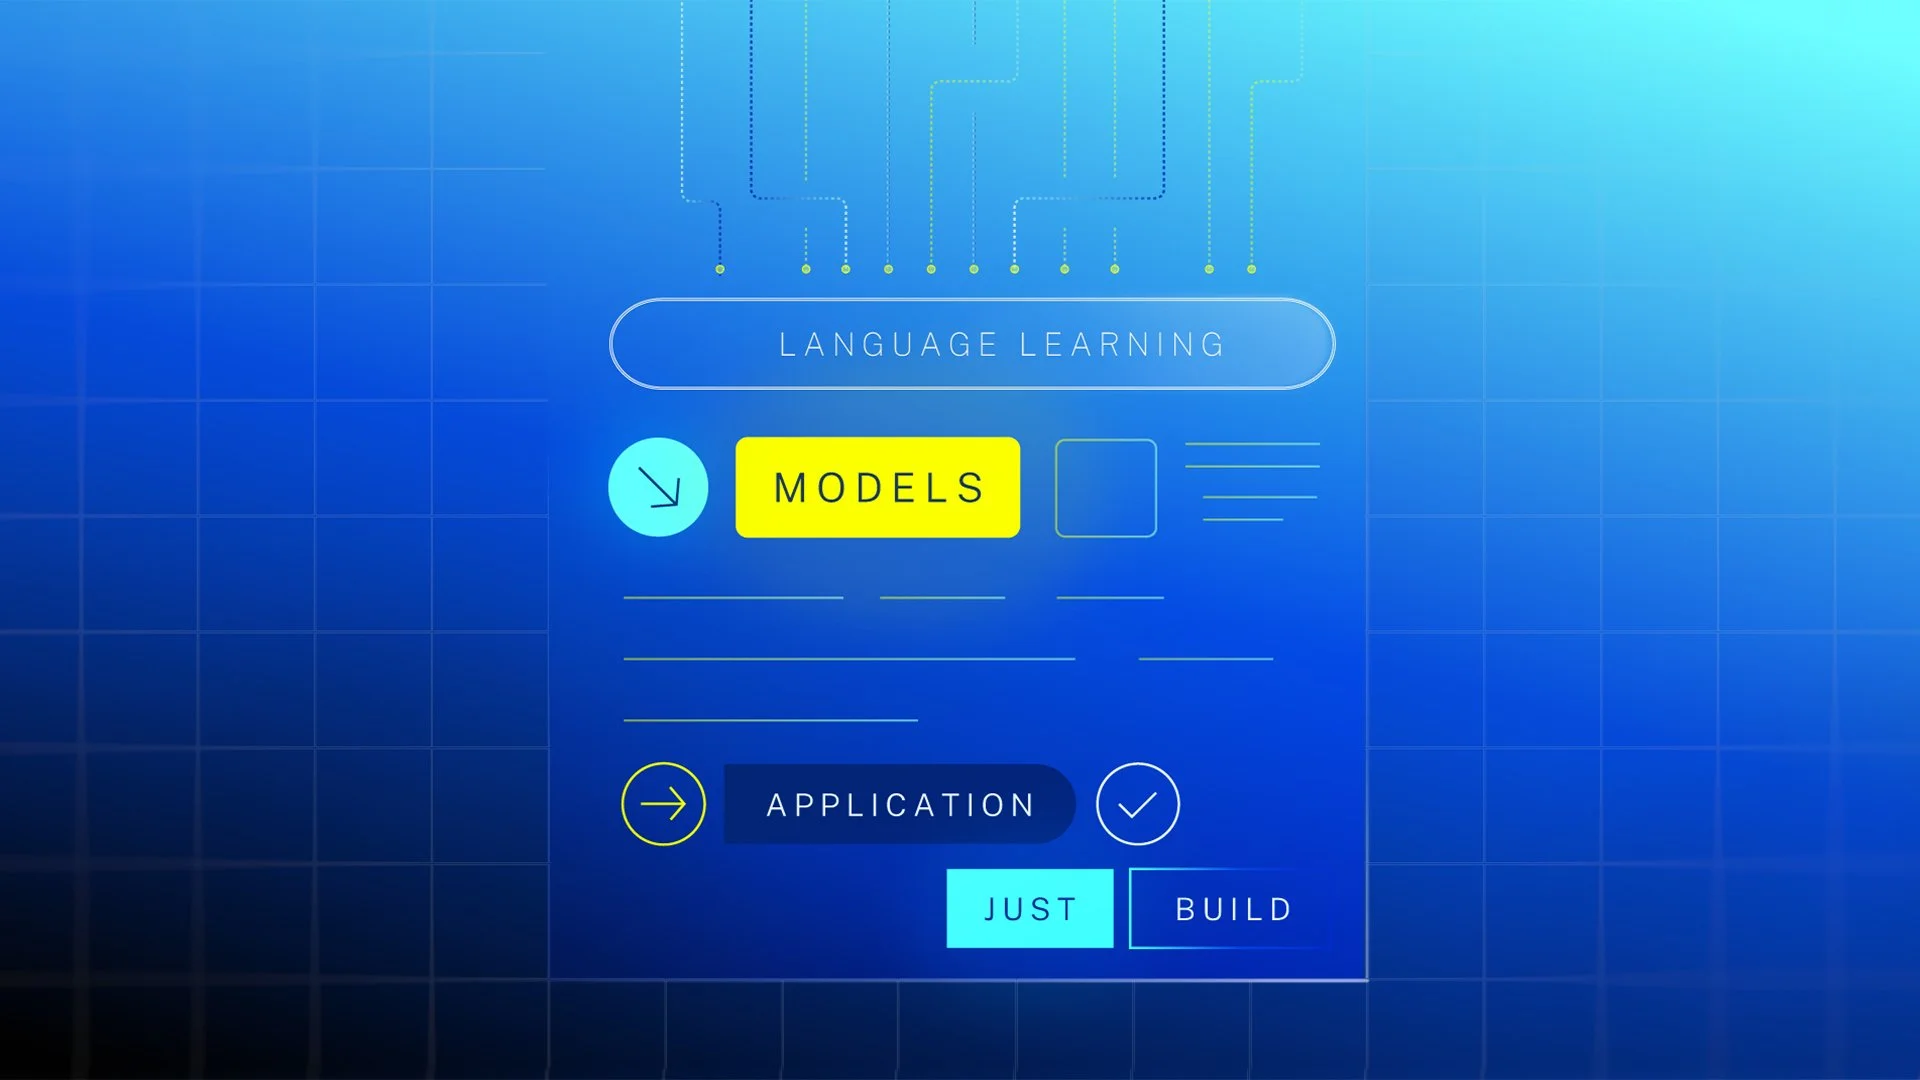
Elevated Look & Feel
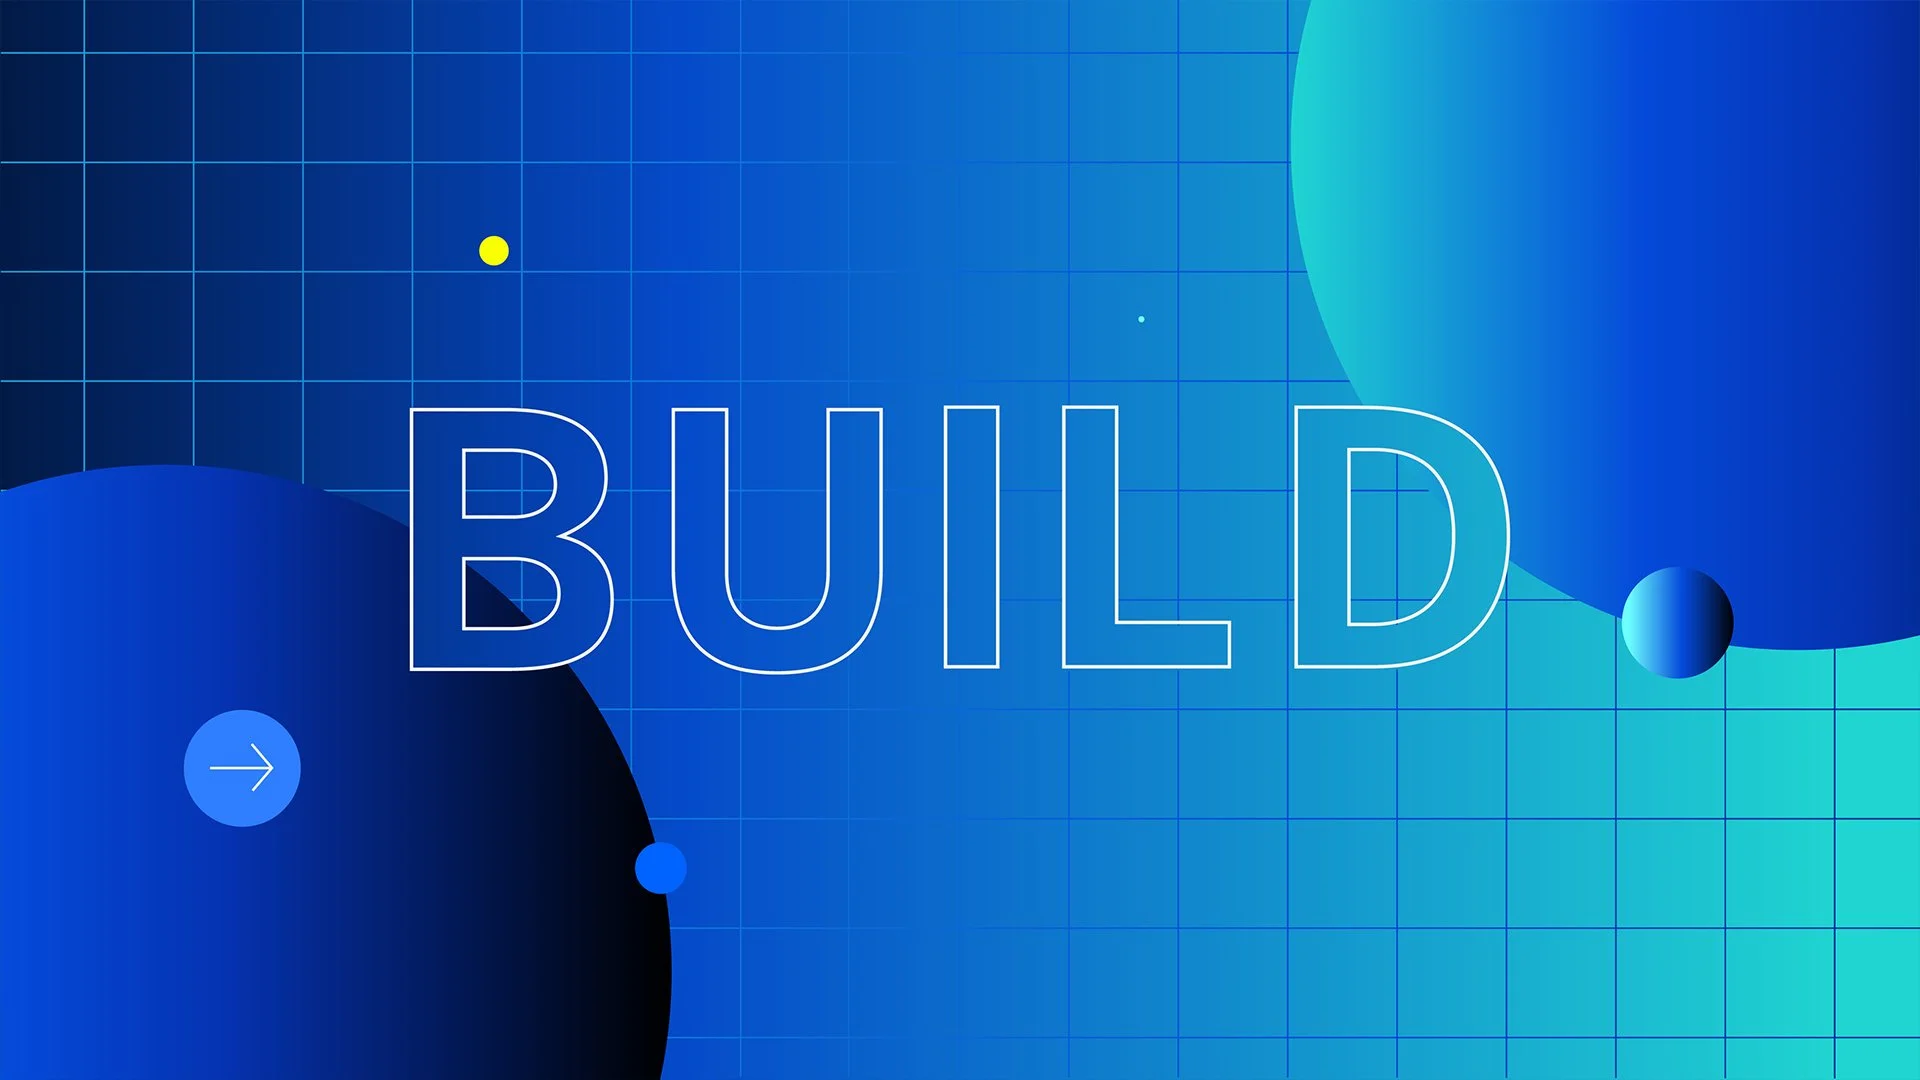
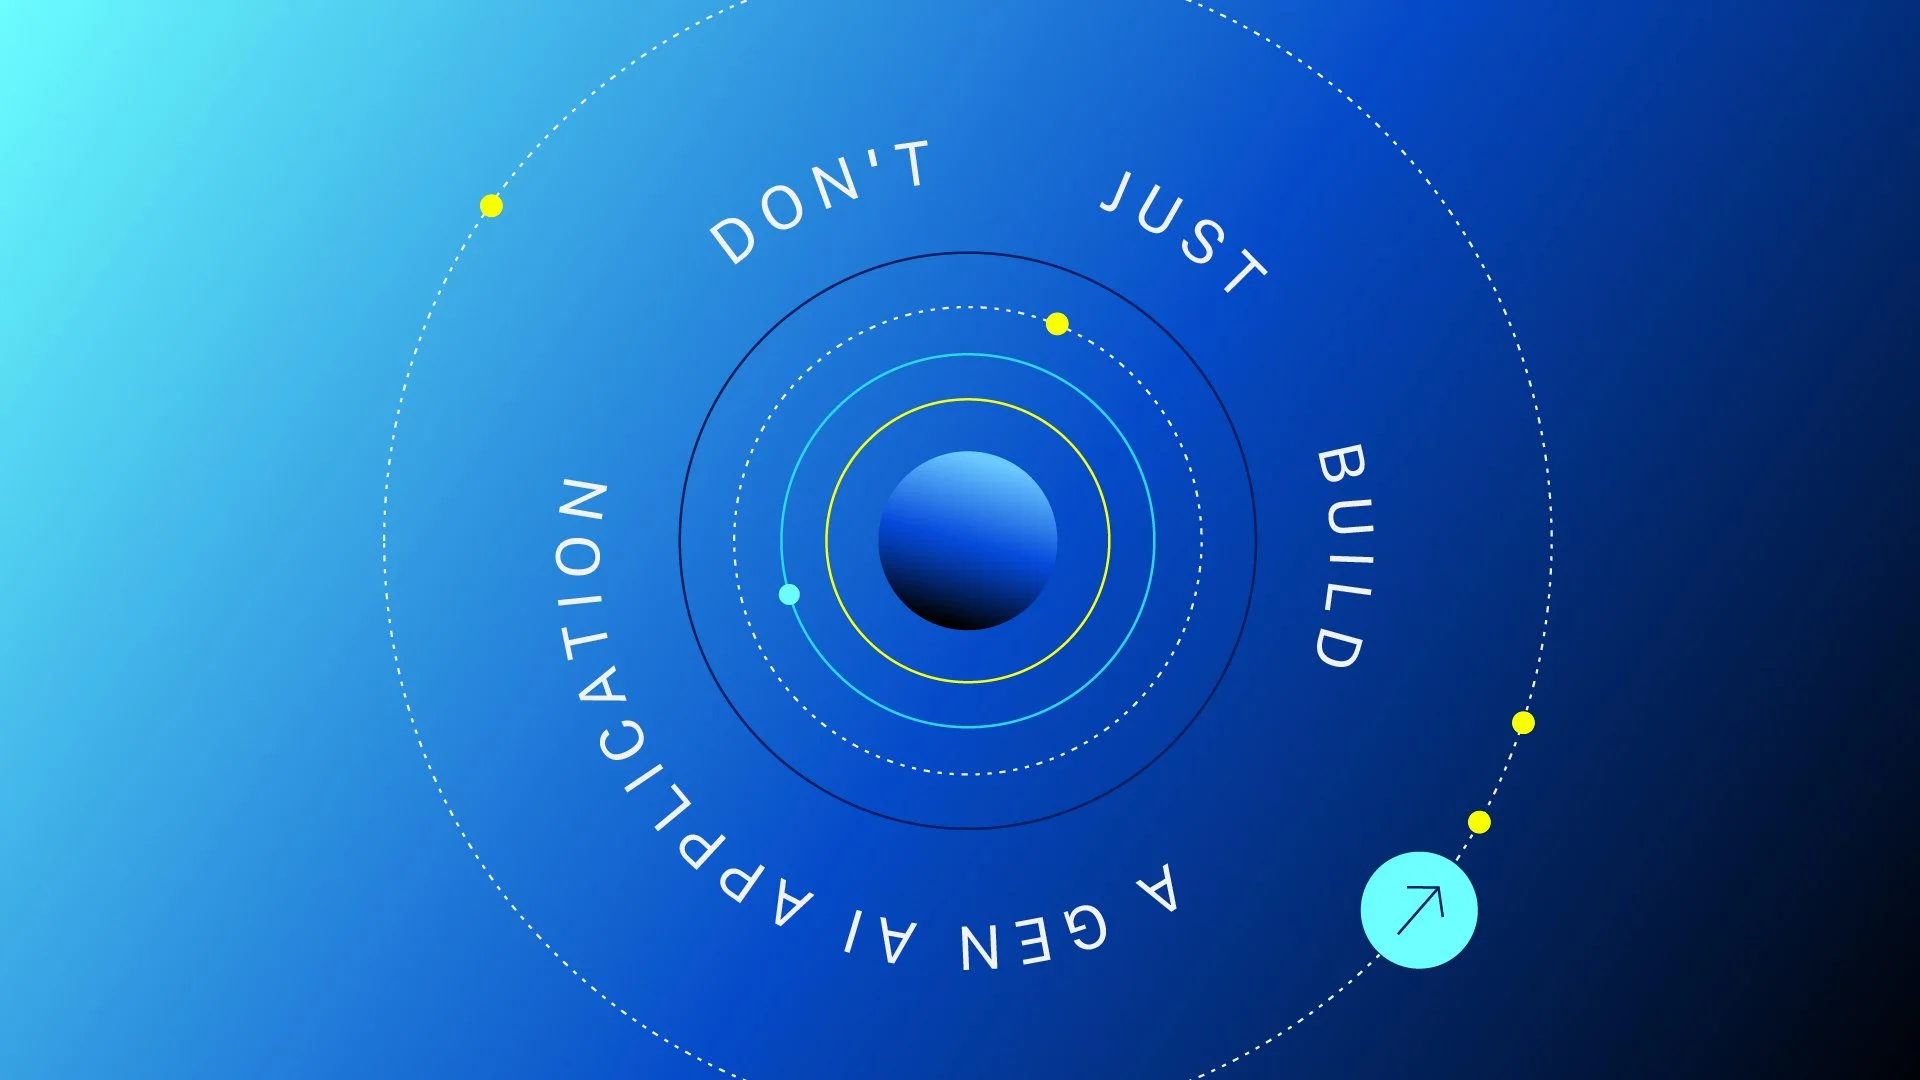
We explored refined typography, balanced color combinations, and a sophisticated palette to shape a more polished visual direction, elevating the overall design quality while preserving clarity and character.
Worlds in transformation

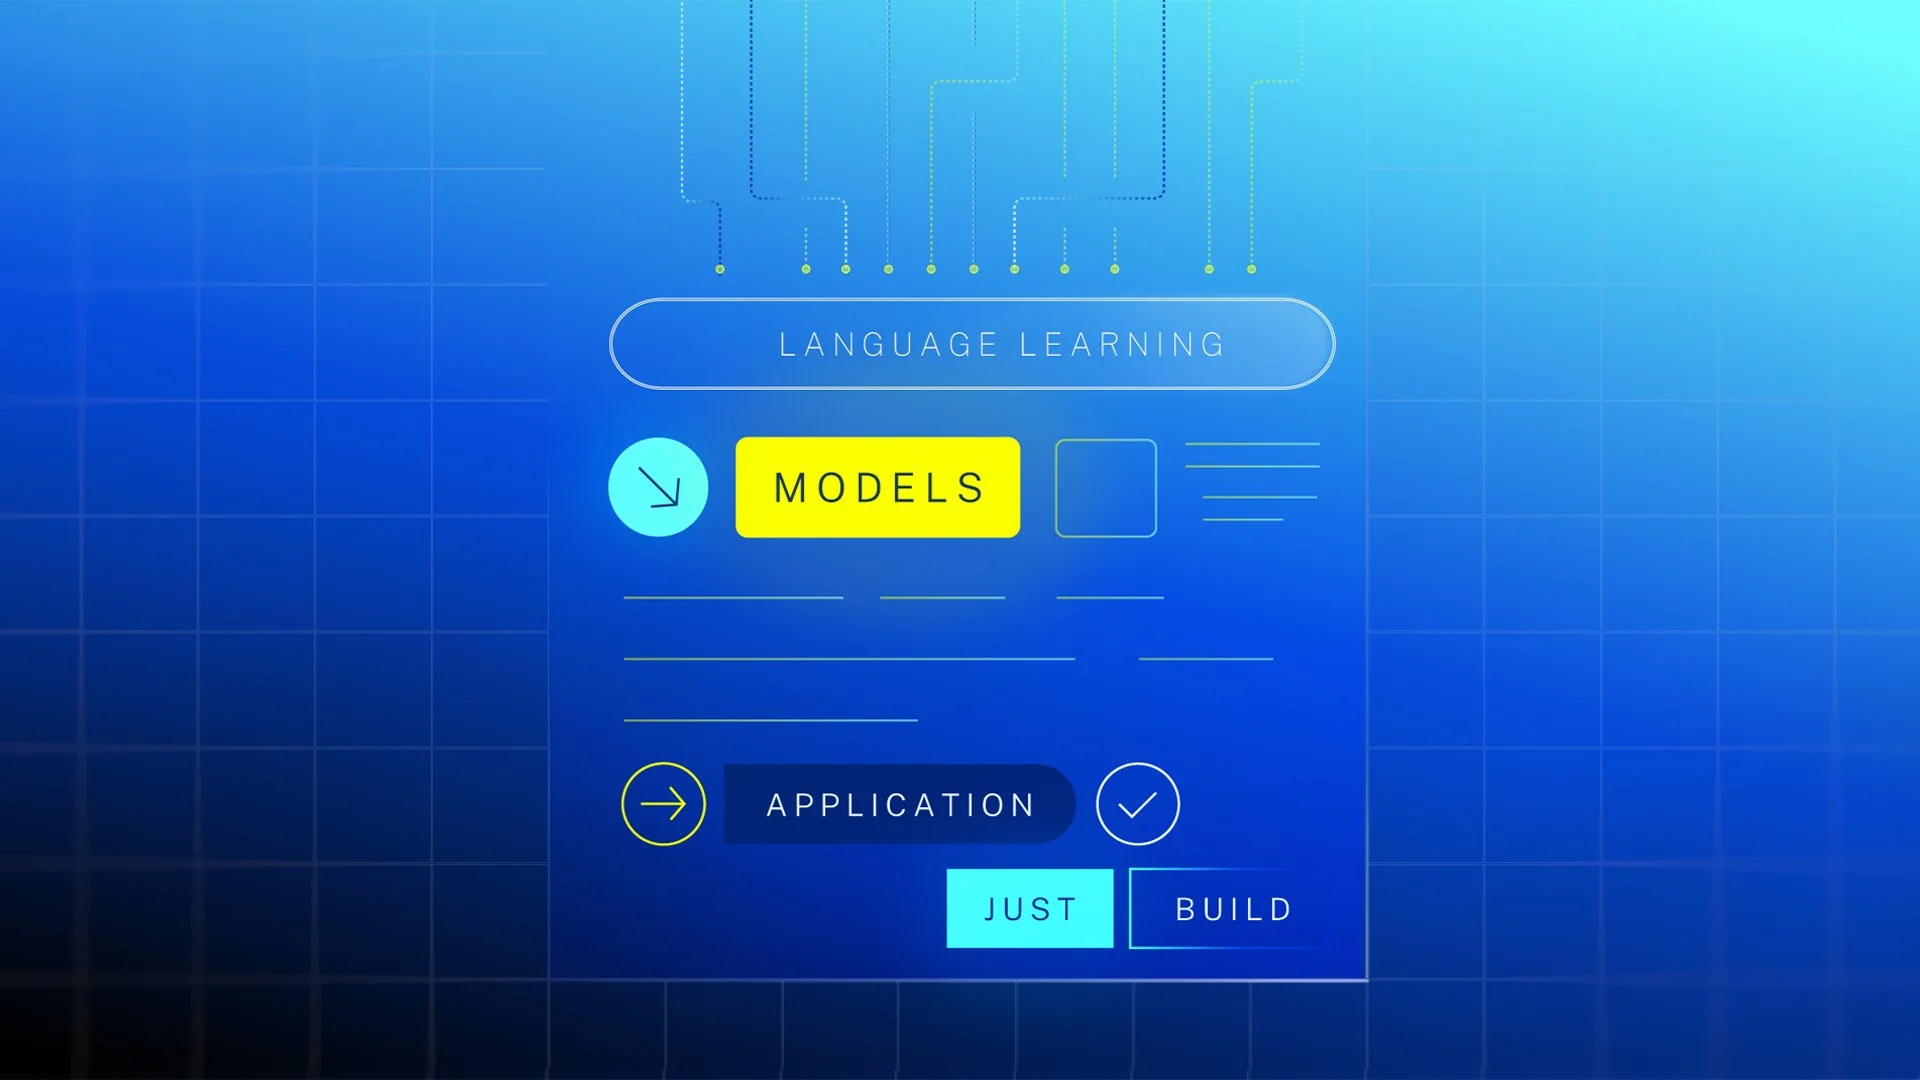
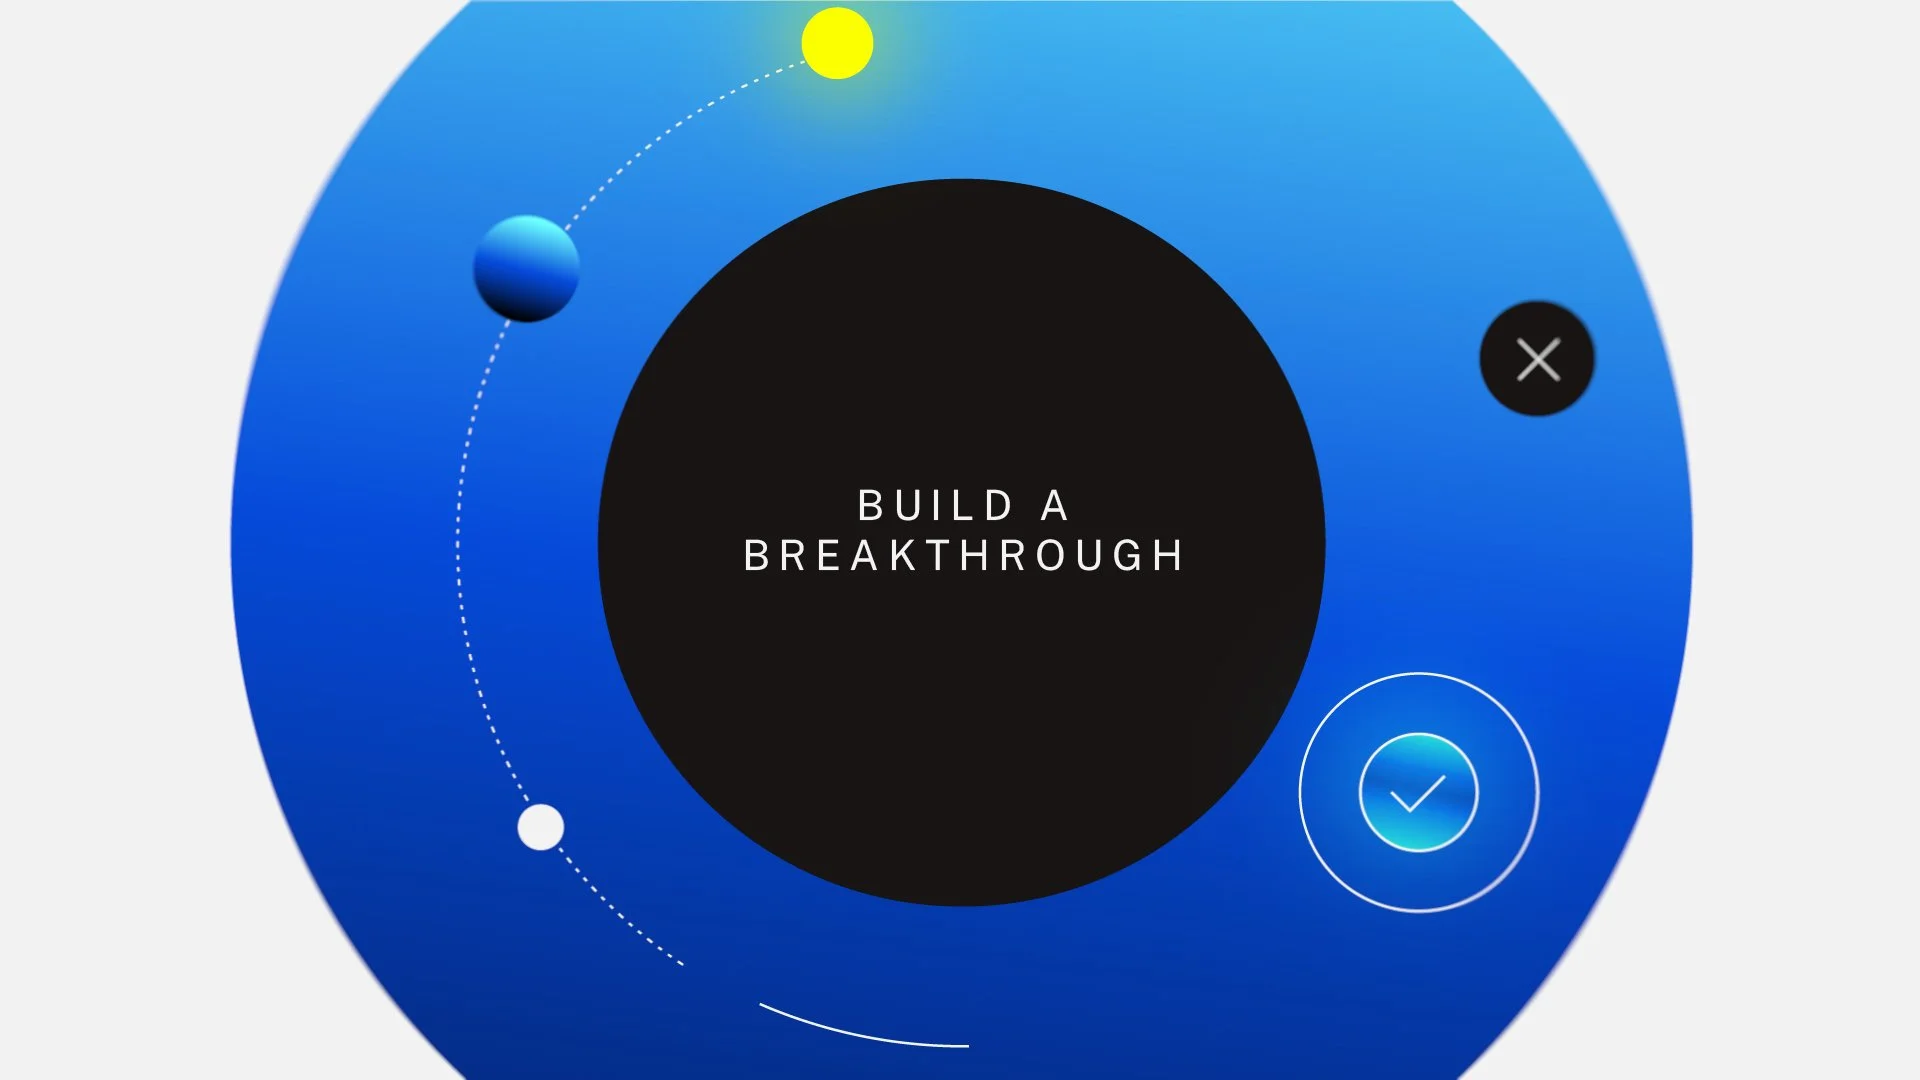
Kaleidoscopic transformations, fluid color flows, and evolving devices create a continuous rhythm of movement, where every transition reshapes the next with a distinct visual twist.
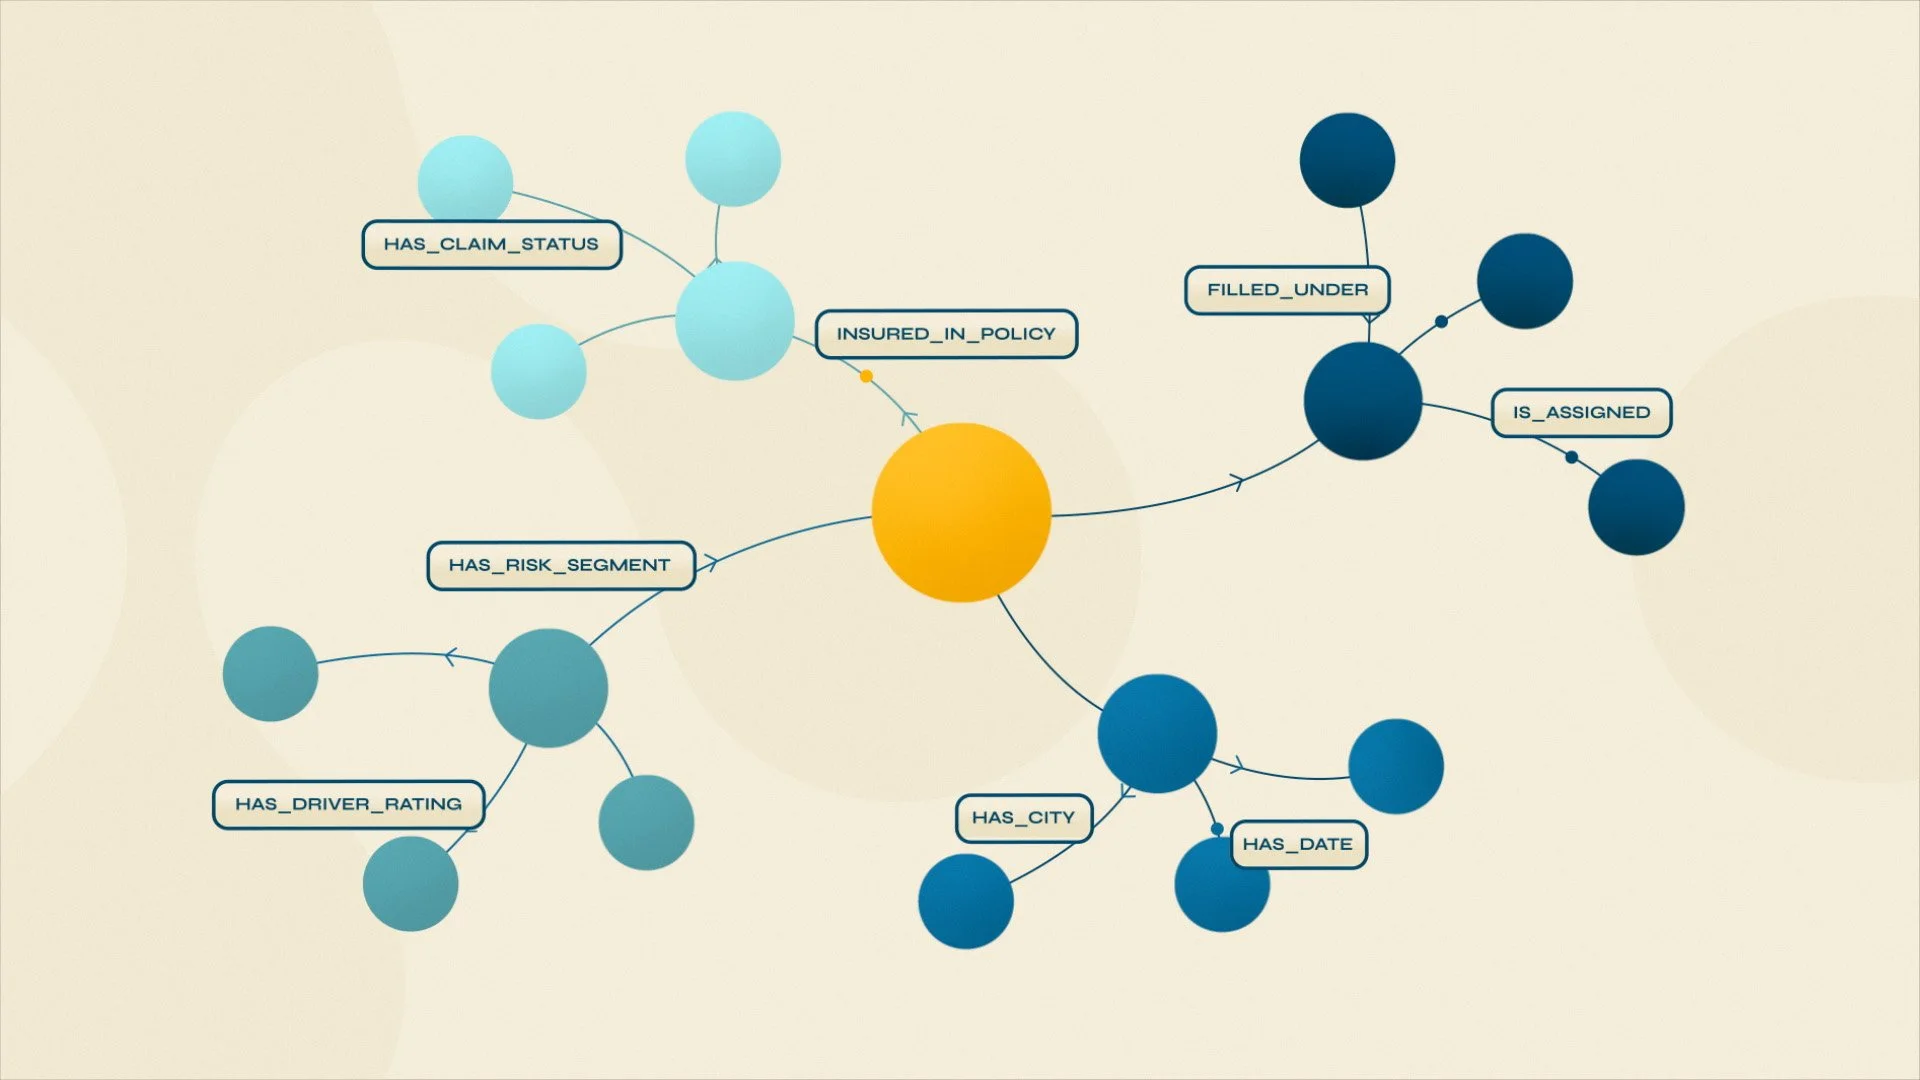


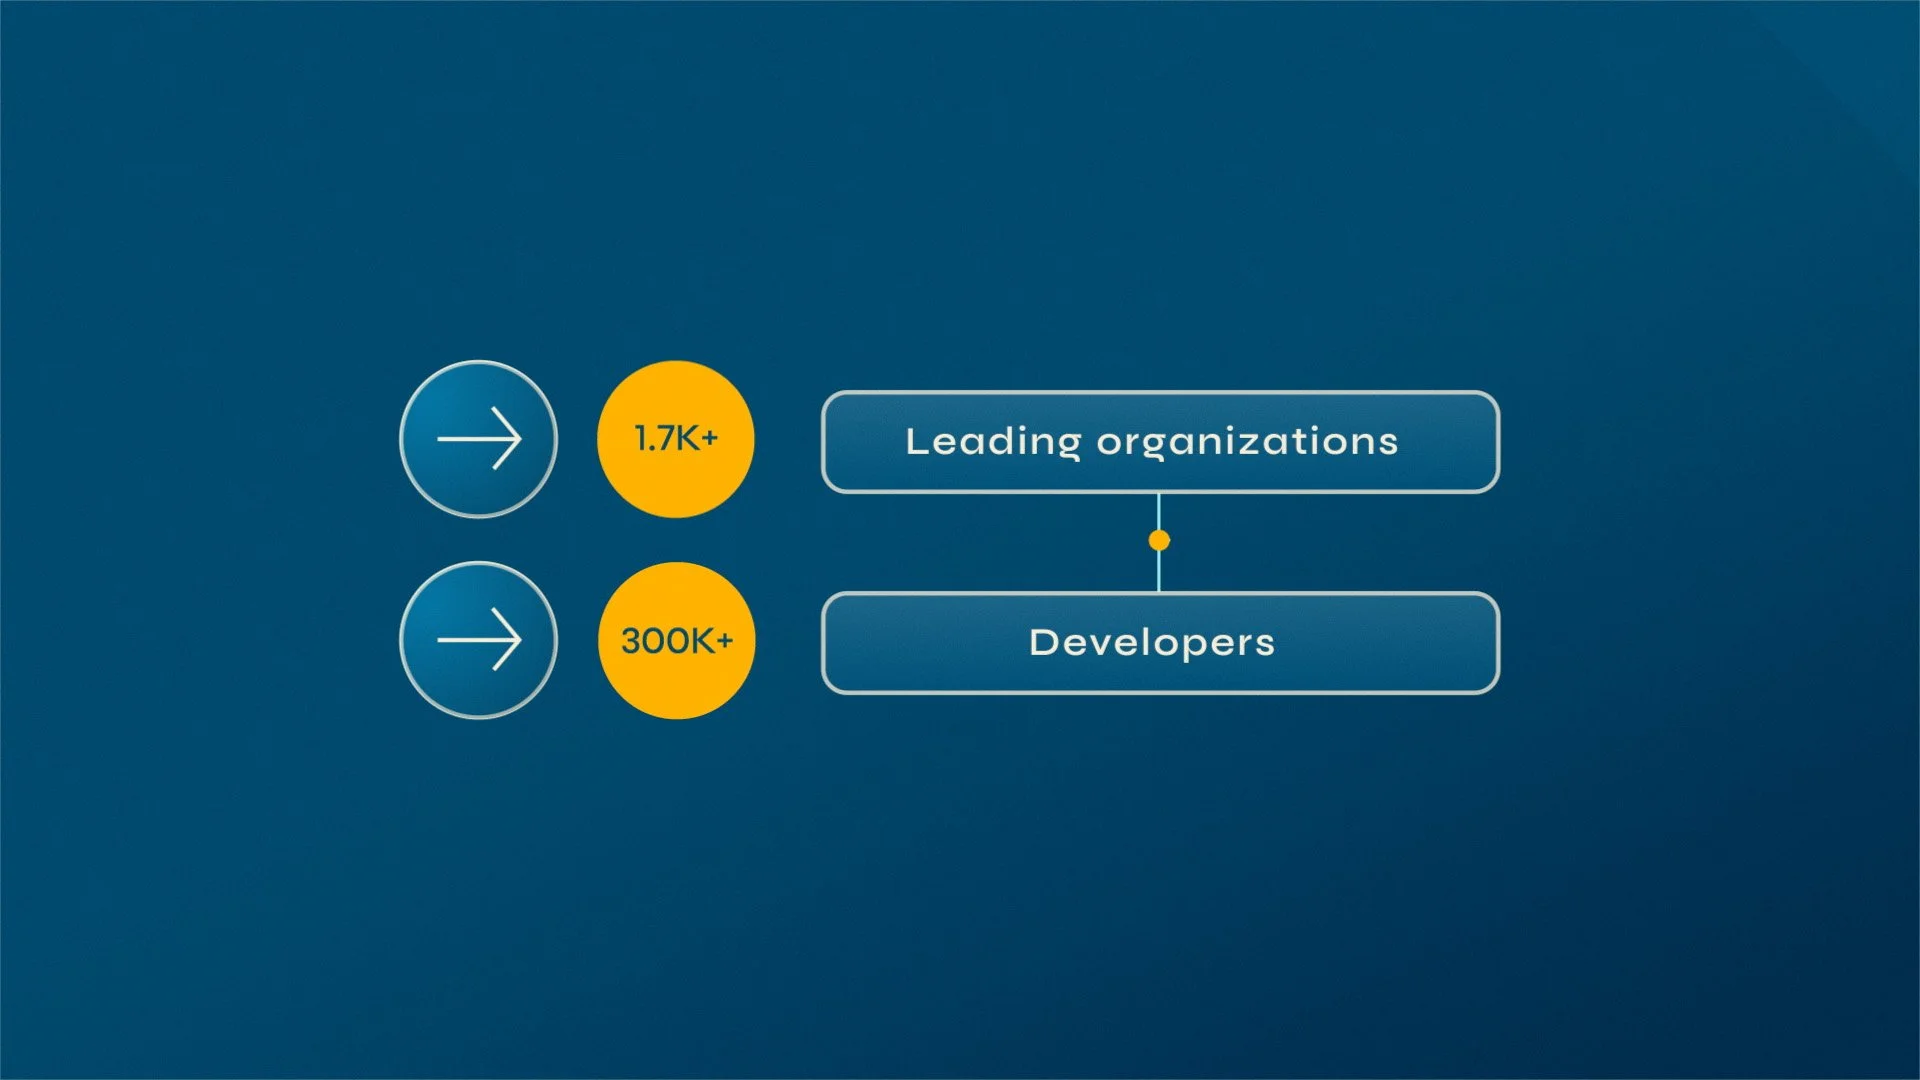
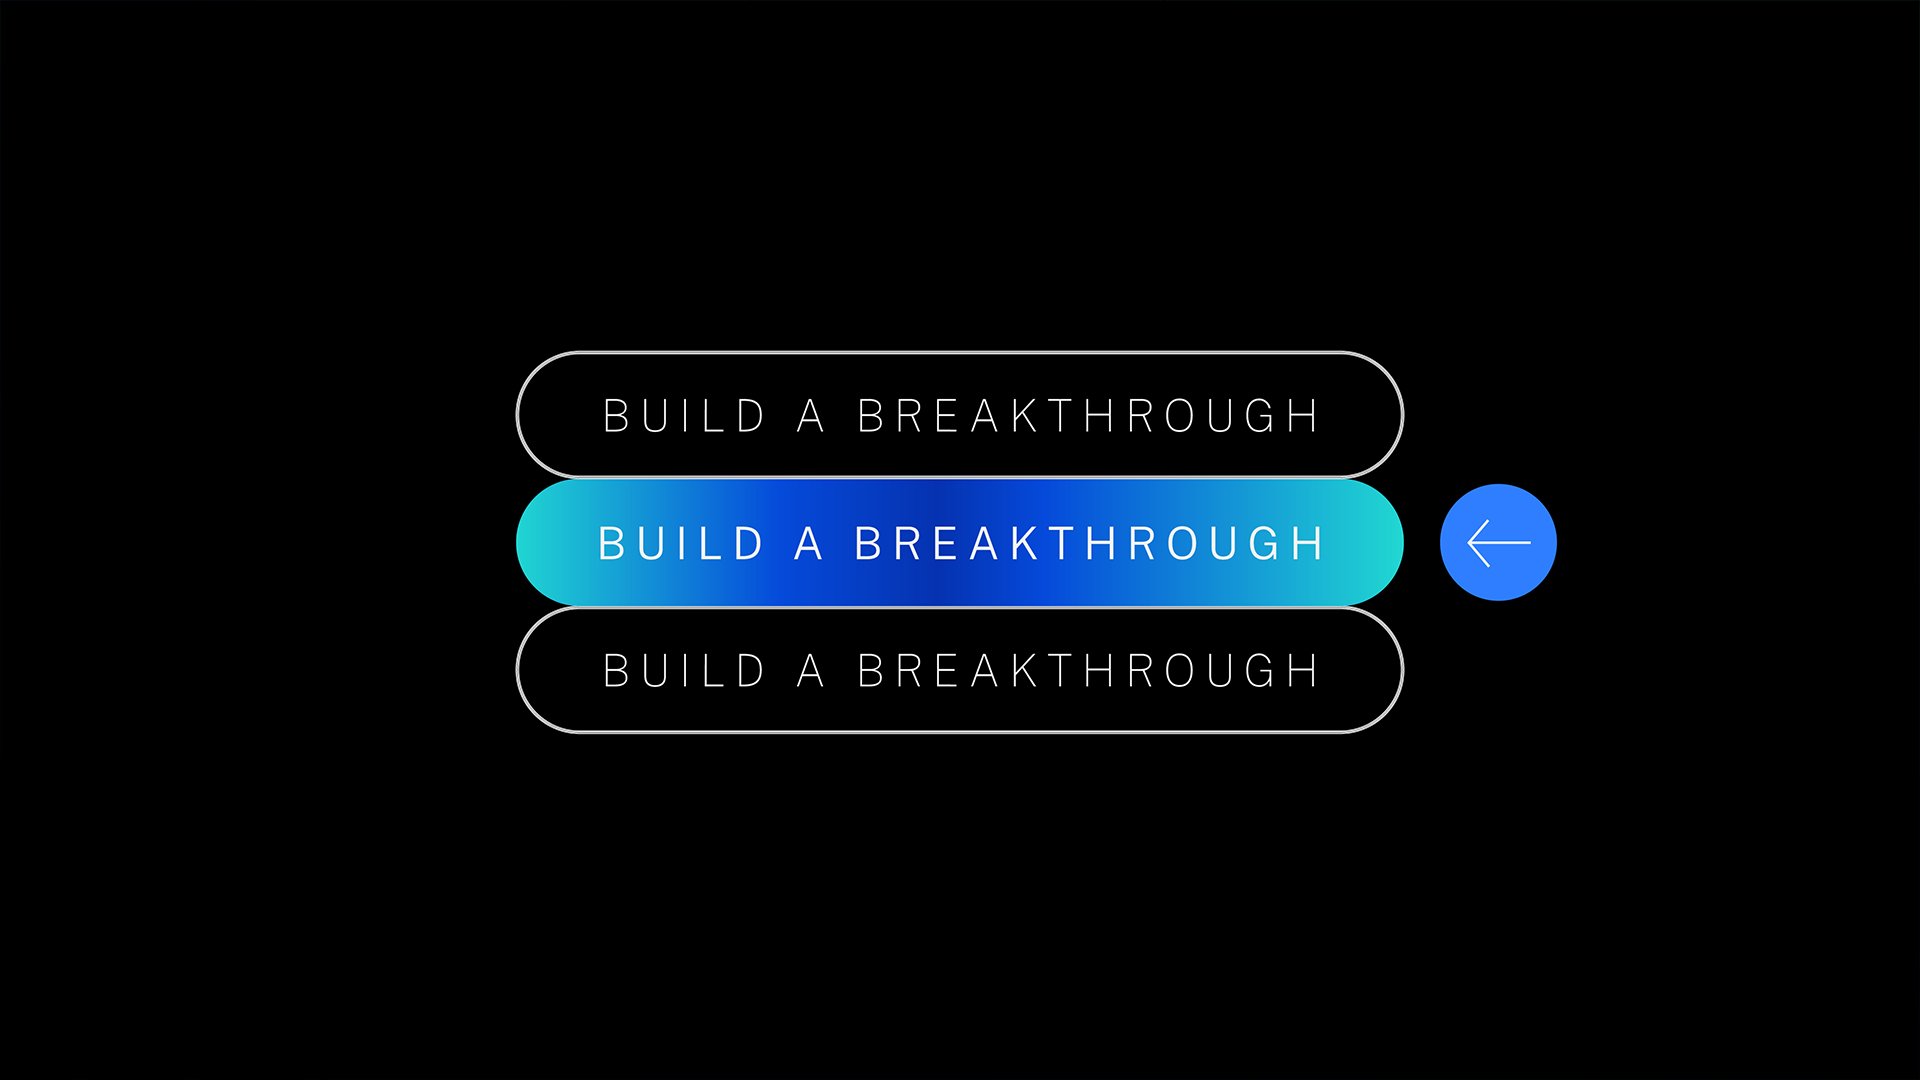
Dark Palette proposal